[ Hide/Show Abstracts | Hide/Show Images ]
To Be Published
Publications
| 2023 | |
 |
[91]
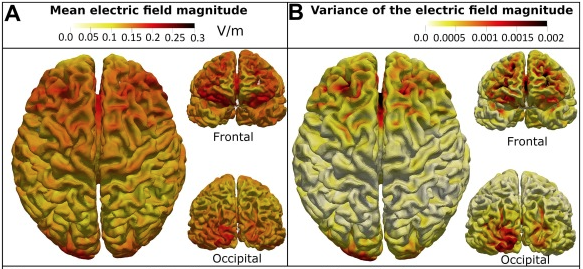
Targeting the Insula With transcranial Direct Current Stimulation; A simulation study
Psychiatry Research: Neuroimaging , Elsevier No. PSYN-D-23-00028 2023 |
| Abstract: Insula is considered an important region of the brain in the generation and maintenance of a wide range of psychiatric symptoms, possibly due to being key in fundamental functions such as interoception and cognition in general. Investigating the possibility of targeting this area using non-invasive brain stimulation techniques can open new possibilities to probe the normal and abnormal functioning of the brain and potentially new treatment protocols to alleviate symptoms of different psychiatric disorders. In the current study, COMETS2, a MATLAB based toolbox was used to simulate the magnitude of the current density and electric field in the brain caused by different transcranial direct current stimulation (tDCS) protocols to find an optimum montage to target the insula and its 6 subregions for three different current intensities, namely 2, 3, and 4 mA. Frontal and occipital regions were found to be optimal candidate regions.. The results of the current study showed that it is viable to reach the insula and its individual subregions using tDCS. | |
| 2022 | |
 |
[90]
The influence of white matter lesions on the electric field in transcranial electric stimulation
NeuroImage: Clinical Vol. 35 No. 103071 2022 [DOI: https://doi.org/10.1016/j.nicl.2022.103071] |
| Abstract: Background. Transcranial direct current stimulation (tDCS) is a promising tool to enhance therapeutic efforts, for instance, after a stroke. The achieved stimulation effects exhibit high inter-subject variability, primarily driven by perturbations of the induced electric field (EF). Differences are further elevated in the aging brain due to anatomical changes such as atrophy or lesions. Informing tDCS protocols by computer-based, individualized EF simulations is a suggested measure to mitigate this variability. Objective. While brain anatomy in general and specifically atrophy as well as stroke lesions are deemed influential on the EF in simulation studies, the influence of the uncertainty in the change of the electrical properties of the white matter due to white matter lesions (WMLs) has not been quantified yet. Methods. A group simulation study with 88 subjects assigned into four groups of increasing lesion load was conducted. Due to the lack of information about the electrical conductivity of WMLs, an uncertainty analysis was employed to quantify the variability in the simulation when choosing an arbitrary conductivity value for the lesioned tissue. Results. The contribution of WMLs to the EF variance was on average only one tenth to one thousandth of the contribution of the other modeled tissues. While the contribution of the WMLs significantly increased ( in subjects exhibiting a high lesion load compared to low lesion load subjects, typically by a factor of 10 and above, the total variance of the EF did not change with the lesion load. Conclusion. Our results suggest that WMLs do not perturb the EF globally and can thus be omitted when modeling subjects with low to medium lesion load. However, for high lesion load subjects, the omission of WMLs may yield less robust local EF estimations in the vicinity of the lesioned tissue. Our results contribute to the efforts of accurate modeling of tDCS for treatment planning. | |
| 2021 | |
 |
[89]
linus: Conveniently explore, share, and present large-scale biological trajectory data from a web browser.
PLOS Computational Biology 2021 [DOI: 10.1371/journal.pcbi.1009503] |
| Abstract: In biology, we often face large-scale trajectory data from dense spatial pathways, such as the brain connectivity obtained from diffusion MRI imaging (Liu et al., 2020), or tracking data such as cell trajectories or animal trails (Romero-Ferrero et al., 2018). Although this type of data is becoming increasingly prominent in biomedical research (Kwok, 2019; McDole et al., 2018; Wallingford, 2019), exploring, sharing, and communicating patterns in such data are often cumbersome tasks requiring a set of different software that are often complex to install, learn and use. Recently, new tools have become available for efficiently visualising 3D volumetric data (Pietzsch et al., 2015; Royer et al., 2015; Schmid et al., 2019), and some of those allow the user to overlay tracking data to cross-check the quality of the results or to visualise simple predefined features (such as speed or time). However, given the more general-purpose design of such software, these are not ideal solutions to efficiently and collaboratively explore and share the visualisations. An interactive, scriptable, and easily shareable visualisation (Shneiderman, 1996) would open up novel ways of communicating and discussing experimental results and findings (Callaway, 2016). The analysis of complex and large-scale trajectory data and the creation and testing of hypotheses could then be done collaboratively. Importantly, since such bioinformatics tools would be right at the interface of computational and life sciences, they need to be accessible and usable for scientists with little or no background in programming. Ideally, the data should be bundled with a guided, interactive presentation in one concise visualisation packet that can be passed to a collaborator. To address these challenges, we have developed our visualisation tool linus, making it easier to explore 3D trajectory data from any device without a local installation of specialised software. linus creates interactive visualisation packets that can be explored in a web browser, while keeping data presentation straightforward and shareable, both offline and online (Fig 1a). We began to develop this tool when we struggled to find adequate software to explore cell trajectories during zebrafish gastrulation from large-scale fluorescence microscopy datasets (Shah et al., 2019). linus allowed us now to interactively visualise and analyse the tracks of around 11.000 cells (starting number) as they moved across the zebrafish embryo throughout 16 hrs. More importantly, it enabled us to share and discuss visualisations with collaborators across disciplines. | |
 |
[88]
Enhancement of Speed and Accuracy Trade-Off for Sports Ball Detection in Videos - Finding Fast Moving, Small Objects in Real-Time
In Basilio Pueo (editor): Sensors (Biosensors/Sensor Technology for Sports Science) , MDPI published: May 6, 2021 Issue. 21 No. 3214 2021 [DOI: 10.3390/s21093214] [paper] |
| 2020 | |
 |
[87]
Case Studies for Working with Domain Experts
In Min Chen, Helwig Hauser, Penny Rheingans, Gerik Scheuermann (editors): Foundations of Data Visualization , Springer International Publishing pp. 24 2020 [ISBN: 978-3-030-34443-6] |
 |
[86]
Coverbild des Informatik Spektrums
Informatik Spektrum 2020 [ISSN: 0170-6012] [paper] |
| Abstract: Zum Titelbild Die Abbildung zeigt rund 12.000 Zell-Tracks, welche die Entwicklung eines Zebrafisch-Embryos in den ersten zwölf Stunden nach Befruchtung darstellen. Neben der Bildauf- nahmetechnik (Lichtblattmikroskopie), welche hochauflösende Einblicke in biologische Prozesse ermöglicht, ist be- sonders interessant, dass die Ergebnisse mit aktuellen Web- Technologien für jedermann erkundbar sind. Dank unseres Visualisierungstools kann jeder interessierte Wissenschaftler die biologischen Resultate der Publikation selbst im Browser seines Computers oder Smartphones betrachten und wird dabei durch verschiedene Methoden der Visualisierung, bspw. Edge Bundling, unterstützt. Multi-scale imaging and analysis identify pan-embryo cell dynamics of germlayer formation in zebrafish Gopi Shah, Konstantin Thierbach, Benjamin Schmid, Johannes Waschke, Anna Reade, Mario Hlawitschka, Ingo Roeder, Nico Scherf und Jan Huisken. | |
 |
[85]
Collaborating Successfully with Domain Experts
In Min Chen, Helwig Hauser, Penny Rheingans, Gerik Scheuermann (editors): Foundations of Data Visualization , Springer International Publishing pp. 9 2020 [ISBN13: 978-3-030-34443-3] |
 |
[84]
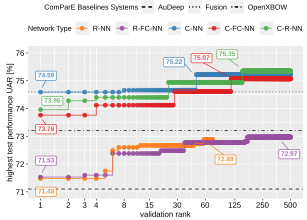
Comparison of Artificial Neural Network Types for Infant Vocalization Classification
IEEE/ACM Transactions on Audio, Speech, and Language Processing , IEEE Vol. 29 No. 0 pp. 54-67 2020 [DOI: 10.1109/TASLP.2020.3037414] [paper] |
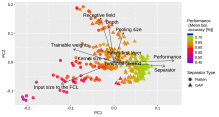
| Abstract: In this study we compared various neural network types for the task of automatic infant vocalization classification, i.e convolutional, recurrent and fully-connected networks as well as combinations of thereof. The goal was to first determine the optimal configuration for each network type to then identify the type with the highest overall performance. This investigation helps to employ neural networks more effectively to infant vocalization classification tasks, which typically offer low amounts of training data. To this end, we defined a unified neural network architecture scheme for audio classification from which we derived various network types. For each type we performed a semi-random hyperparameter search which employed regression trees to both focus the search space as well as derive insights on the most influential parameters. We finally compared the test performances of the best performing configurations in an contest-like setup. Our key findings are: (1) Networks with convolutional stages reached the highest performance, regardless of being combined with fully-connected or recurrent layers. (2) The most influential architectural hyperparameter for all types were the integration operations for reducing tensor dimensionality between network stages. The best performing configurations reached test performances of 75 percent unweighted average recall, surpassing previously published benchmarks. | |
 |
[83]
Automatic Classification of Infant Vocalization Sequences with Convolutional Neural Networks
Speech Communication Vol. 119 pp. 36–45 May 2020 [DOI: 10.1016/j.specom.2020.03.003] [paper] |
| Abstract: In this study we investigated Convolutional Neural Networks (CNNs) for the classification of infant vocalization sequences. The target classes were 'crying', 'fussing', 'babbling', 'laughing' and 'vegetative vocalizations'. The general case of this classification task is of importance for applications which require a qualitative evaluation of general infant vocalizations, such as pain assessment or assessment of language acquisition. The classification procedure was based on representing audio segments as spectrograms which are input to an conventional CNN architecture scheme. We systematically analyzed the influence of network features on the classification performance to derive guidelines for designing effective CNN architectures for the task. We show that CNNs should be modeled to have a small bottleneck between the convolutional stage and the fully connected stage, achieved through broad aggregation of convolutional feature maps across the time and frequency axis. The best performing CNN configuration yielded a balanced accuracy of 72 percent. We conclude that conventional CNN architectures can reach satisfactory performance for this task even with small amounts of training data as long as certain network features are ensured. | |
 |
[82]
A flexible workflow for simulating transcranial electric stimulation in healthy and lesioned brains
bioRxiv January 2020 [DOI: 10.1101/2020.01.09.900035] [paper] |
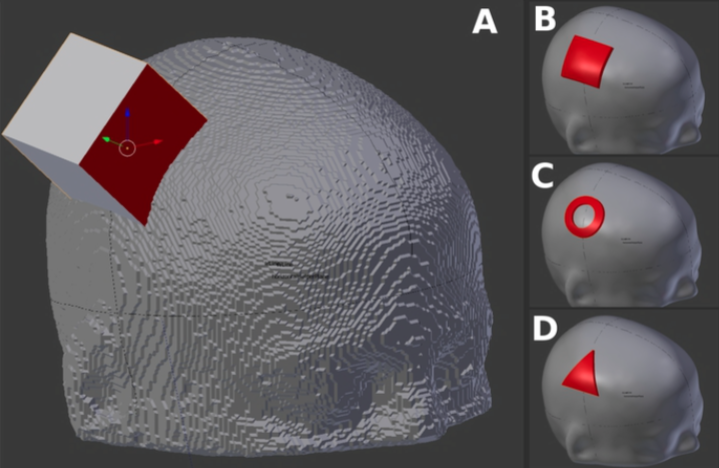
| Abstract: Simulating transcranial electric stimulation is actively researched as knowledge about the distribution of the electrical field is decisive for understanding the variability in the elicited stimulation effect. Several software pipelines comprehensively solve this task in an automated manner for standard use- cases. However, simulations for non-standard applications such as uncommon electrode shapes or the creation of head models from non-optimized T1-weighted imaging data and the inclusion of irregular structures are more difficult to accomplish. We address these limitations and suggest a comprehensive workflow to simulate transcranial electric stimulation based on open-source tools. The workflow covers the head model creation from MRI data, the electrode modeling, the modeling of anisotropic conductivity behavior of the white matter, the numerical simulation and visualization. Skin, skull, air cavities, cerebrospinal fluid, white matter, and gray matter are segmented semi- automatically from T1-weighted MR images. Electrodes of arbitrary number and shape can be modeled. The meshing of the head model is implemented in a way to preserve feature edges of the electrodes and is free of topological restrictions of the considered structures of the head model. White matter anisotropy can be computed from diffusion-tensor imaging data. Our solver application was verified analytically and by contrasting tDCS simulation results with another simulation pipeline (SimNIBS 3.0). An agreement in both cases underlines the validity of our workflow. Our suggested solutions facilitate investigations of irregular structures in patients (e.g. lesions, implants) or of new electrode types. For a coupled use of the described workflow, we provide documentation and disclose the full source code of the developed tools. | |
 |
[81]
A group-level sensitivity analysis to assess the influence of white matter lesions on the electrical field in simulations of transcranial electric stimulation
Clinical Neurophysiology Issue. 131 No. 4 4 2020 [DOI: 10.1016/j.clinph.2019.12.304] [Preprint] |
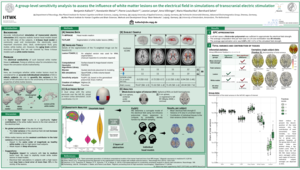
| Abstract: Simulations of transcranial electric stimulation (tES) based on realistic head models generated from individual MR imaging data provide insight into the subject-specific distribution of the electrical field. Common structures considered in the involved head models comprise the large, electrically most important tissues, such as skin, skull, cerebrospinal fluid, gray matter, white matter, and air. The aging brain is subjected to structural changes such as atrophy and lesions of the white matter (WML). While changes in the field distribution due to atrophy have been confirmed before, the influence of white matter lesions is still unclear. We hypothesize that lesions of the white matter alter the electrical properties of the white matter tissue in an area large enough to exert an influence on the distribution of the electrical field in tES simulations. In this study, we investigate the influence of WML on the distribution of the electrical field by performing a group-level sensitivity analysis with respect to uncertainty in tissue conductivity using individualized head models. We specifically focus on a high uncertainty in the conductivity of WML ([0.04,1.5]Sm-1). Seventy-eight subjects, gender- (\#female: 39) and age-matched (yrs: 70.81 +/- 3.39) are distributed across three groups according to their lesion load, classified according to the Fazekas scale ranging from 1 (F1) to 3 (F3) (mean, normalized, relative lesion volumes: F1=0.780% +/- 0.007%, F2=2.550% +/- 0.024%, F3=8.6800% +/- 0.0355%). A bihemispheric electrode montage over primary motor cortices (10-20 coordinates: C3, C4) with 1mA current strength is simulated. We report the variance of the computed electrical field strength due to the uncertainty in tissue conductivity and analyze the individual contribution of the WML tissue uncertainty to the observed deviation. Preliminary group-level results of the high lesion load group (F3) suggest only a small mean influence of the WMLs to the total variance in the primary motor cortex area of less than 2%, which is in the range of the remaining healthy white matter tissue. However, in the sulcal depths, a higher contribution of the WMLs on a single-subject level of up to 15.6% can be found. Analyses of the medium (F2) and low (F1) lesion load group are conducted to verify this observation and to determine whether the extent of the lesion or the uncertainty in tissue conductivity affects the contribution more. Our results are going to inform whether white matter changes of the aging brain must be considered for accurate simulation and application of tES. | |
| 2019 | |
 |
[80]
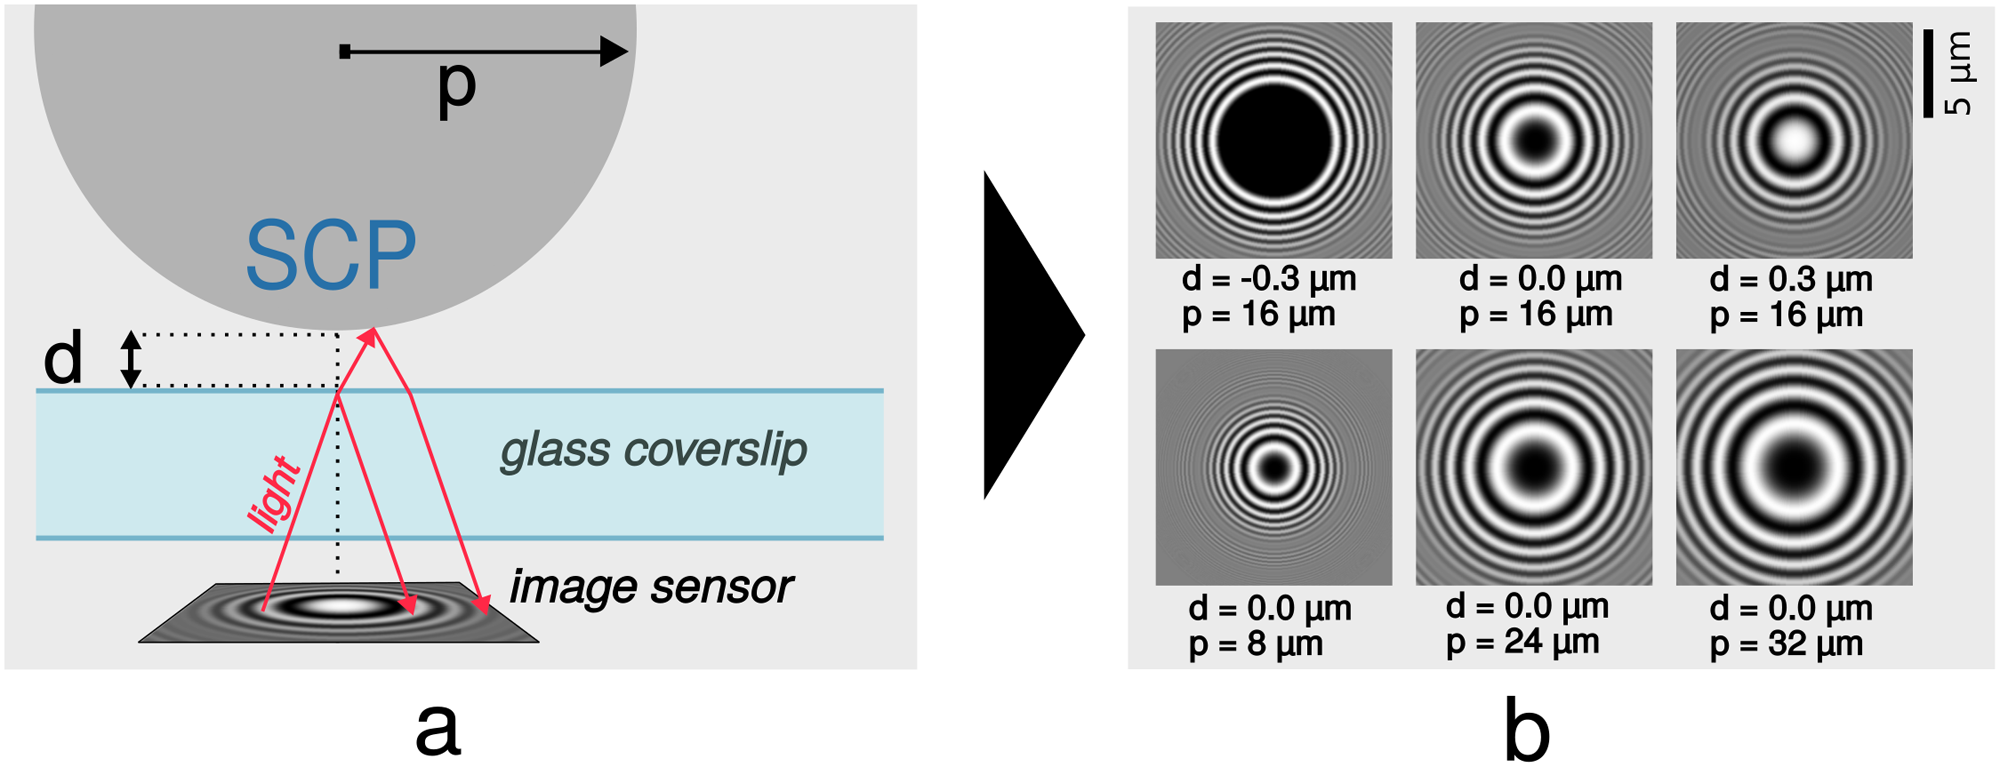
Radial Profile Detection of Multiple Spherical Particles in Contact with Interacting Surfaces
PLOS ONE Vol. 14 No. 4 2019 [DOI: 10.1371/journal.pone.0214815] |
| Abstract: Adhesive interactions of soft materials play an important role in nature and technology. Interaction energies can be quantified by determining contact areas of deformable microparticles with the help of reflection interference contrast microscopy (RICM). For high throughput screening of adhesive interactions, a method to automatically evaluate large amounts of interacting microparticles was developed. An image is taken which contains circular interference patterns with visual characteristics that depend on the probe's shape due to its surface interaction. We propose to automatically detect radial profiles in images, and to measure the contact radius and size of the spherical probe, allowing the determination of particle-surface interaction energy in a simple and fast imaging and image analysis setup. To achieve this, we analyze the image gradient and we perform template matching that utilizes the physical foundations of reflection interference contrast microscopy. | |
 |
[79]
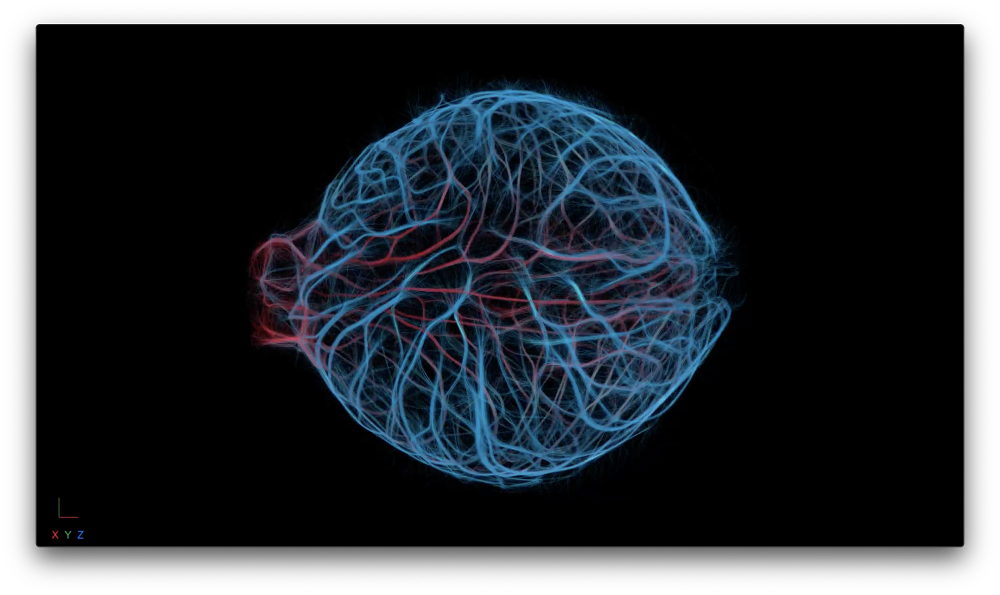
Multi-scale imaging and analysis reveals pan-embryo cell dynamics of germlayer formation in zebrafish
Nature Communications 12 2019 [DOI: 10.1038/s41467-019-13625-0] [paper] |
| Abstract: The coordination of cell movements across spatio-temporal scales ensures precise positioning of organs during vertebrate gastrulation. Mechanisms governing such morphogenetic movements have been studied only within a local region, a single germlayer or in whole embryos without cell identity. Scale-bridging imaging and automated analysis of cell dynamics are needed for a deeper understanding of tissue formation during gastrulation. Here, we report pan-embryo analyses of formation and dynamics of all three germlayers simultaneously within a developing zebrafish embryo. We show that a distinct distribution of cells in each germlayer is established during early gastrulation via cell movement characteristics that are predominantly determined by their position in the embryo. The differences in initial germlayer distributions are subsequently amplified by a global movement, which organizes the organ precursors along the embryonic body axis, giving rise to the blueprint of organ formation. The tools and data are available as a resource for the community. | |
| 2018 | |
 |
[78]
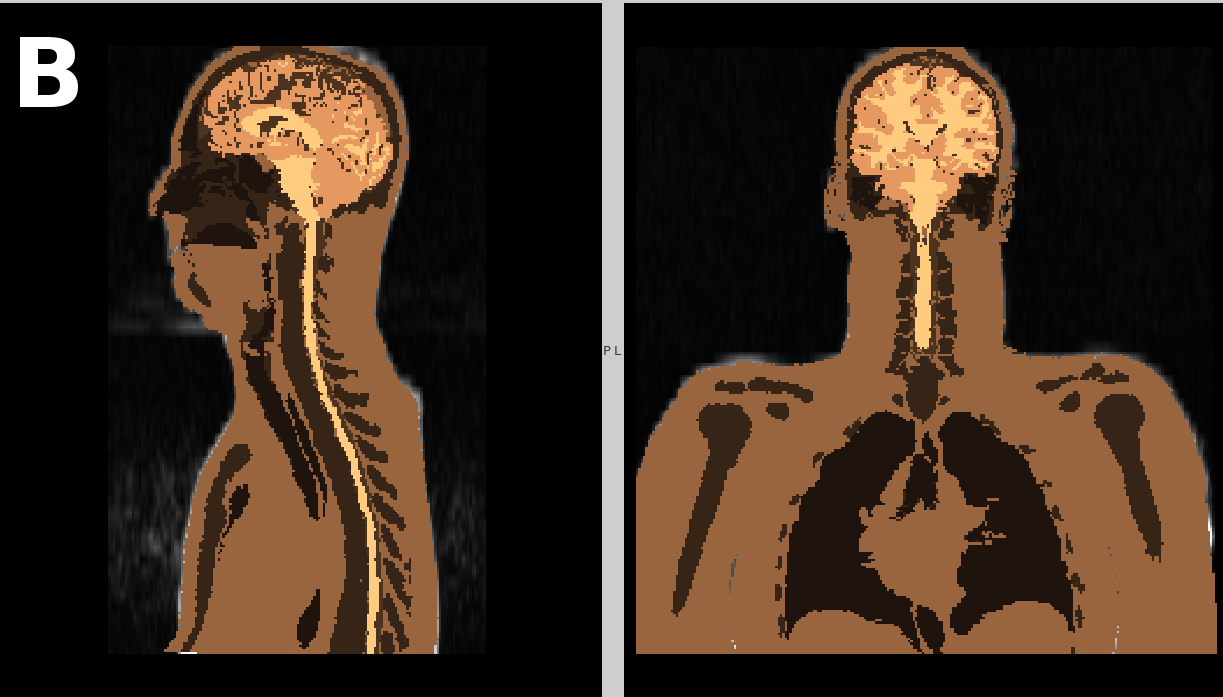
Semi-automated generation of individual computational models of the human head and torso from MR images
Magnetic Resonance in Medicine September 2018 [DOI: 10.1002/mrm.27508] |
| Abstract: Purpose: Simulating the interaction of the human body with electromagnetic fields (EMF) is an active field of research. Individualized models are increasingly being taken into consideration since anatomical differences are an influencing factor for simulations. We introduce a processing pipeline for creating individual surface-based models of the human head and torso. The pipeline is designed for easy reproducibility and is publicly released on figshare. Methods: All steps from image acquisition to surface mesh generation of the single, external boundary of the structures of interest are covered. Two preset sequences by Siemens are employed to acquire images of the subjects' head and body. Structures are segmented using atlas-based approaches and comprise the skin/scalp, bone/skull, subarachnoid cerebrospinal-fluid, gray matter, white matter, the spinal cord, the lungs and the sinuses of the skull. Segmentation images are processed to so-called segmentation masks, binarized, cleaned images per segmented structure without an internal boundary. Boundaries of these masks are finally triangulated. Results: Application of the workflow to two subjects show that Individual differences are well represented. The models are proven to be suitable for EMF simulation of the radio-frequency EMF amplitude, , and the specific absorption rate. Conclusion: Image segmentation, creation of segmentation masks and surface mesh generation are fully automated. Integrating the segmentation images of the head and body into one common segmentation image and preparing this image for segmentation mask generation necessitates manual intervention. The generated surfaces exhibit a single boundary per structure and are of suitable quality for processing in finite element method simulation software. | |
 |
[77]
Evaluation of Guide Wire Proficiency During a Catheter-based Intervention
Poster Honorable Mention Award 2018 [paper] [conference] |
| Abstract: Catheter-based interventions are crucial for diagnostics and therapy in cardiology, neurology and other medical disciplines. Operator skills heavily influence the outcome of these interventions, but there are no standards of teaching and it is unclear how these skills develop over time. Here, we present a visualization that summarizes the guide wire skill of an operator based on a performed intervention. The data is derived from videos of training sessions on a simulator for catheter-based interventions. Requirements on the visualization were formulated in dialogue with an expert. Accordingly, key properties visualized in this work include speed, smoothness, and locations of recurrent mistakes. | |
 |
[76]
Slice-based Visualization of Brain Fiber Bundles - A LIC-based Approach
In Alexandru Telea, Andreas Kerren, Jose Braz (editors): Proceedings of the 13th International Joint Conference on Computer Vision, Imaging and Computer Graphics Theory and Applications (VISIGRAPP 2018) - Volume 3: IVAPP, Funchal, Madeira, Portugal, January 27-29, 2018. , SciTePress pp. 291–288 January 2018 [DOI: 10.5220/0006619402810288] [ISBN: 978-989-758-289-9] [Preprint] [paper] |
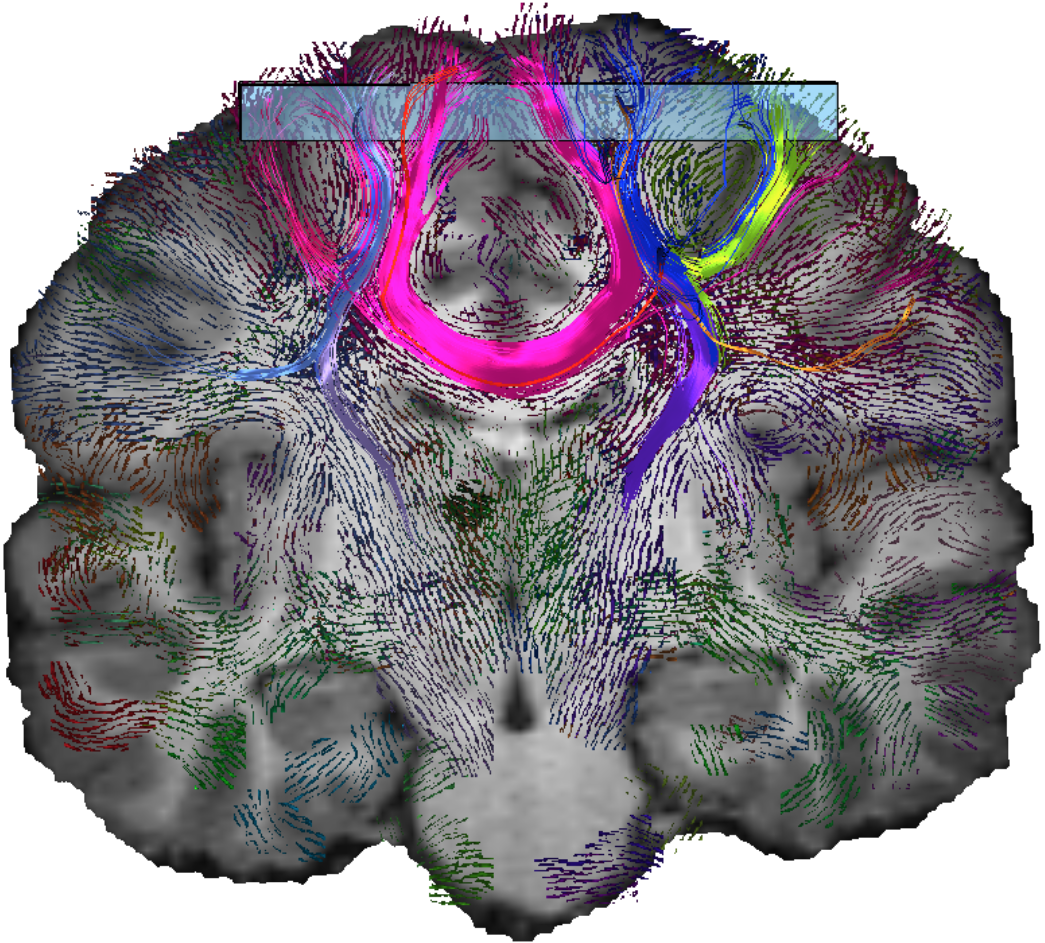
| Abstract: The reconstruction of brain fibers from diffusion MRI data is a widely studied field. There is a great variety of algorithms to generate fiber tracts. Despite the many possibilities to create fiber tractograms, it is not very common within the medical community to make use of them. We think there are two reasons why the acceptance of this technique is so low. The first reason is that most time the degree of detail provided by singular fibers is neither justified nor needed. Second, within the medical domain tractography visualization is still uncommon. To solve the first problem it is common to apply clustering algorithms which aggregate the single fibers to fiber bundles. In this paper, we display the fiber bundles within slices. The presentation within slices is common within the medical community and very intuitive to examine. Furthermore, our visualization allows the spatial assignment of fiber bundles to the brain structure provided as T1 images. Among many neuroscientists and ph ysicians, T1 images are the main source for spatial orientation within the brain. | |
| 2017 | |
 |
[75]
Decomposition of Vector Fields Beyond Problems of First Order and Their Applications
TopoInVis 2015, Mathematics and Visualization , Springer, Cham pp. 205-219 2017 [DOI: 10.1007/978-3-319-44684-4_12] [ISBN: 978-3-319-44682-0] |
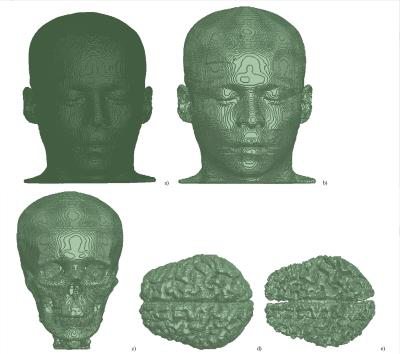
| Abstract: In our paper, we discuss generalized vector field decompositions that mainly have been derived from the classical Helmholtz-Hodge-decomposition. The ability to decompose a field into a kernel and a rest respectively to an arbitrary vector-valued linear differential operator allows us to construct decompositions of either toroidal flows or flows obeying differential equations of second (or even fractional) order and a rest. The algorithm is based on the fast Fourier transform and guarantees a rapid processing and an implementation that can be directly derived from the spectral simplifications concerning differentiation used in mathematics. | |
 |
[74]
Toward individualized specific absorption rates: building a surface based head model from MRI to study travel wave excitation
25th Annual Meeting of the International Society of Magnetic Resonance Imaging in Medicine (ISMRM) 2017 [Online PDF] [paper] |
| Abstract: We built a prototype of a high resolution surface-based human head model that can be simulated in a reasonable time and evaluated the influence of cerebrospinal fluid (CSF) on field propagation estimates of traveling wave excitation at 297.2 and 400 MHz. Combining neighboring triangular faces located in the same plane into a single one is an approach that achieves simulations of high-resolution human models previously not accessible to tetrahedral-mesh-based solvers. If electrical contact between anatomically connected parts of CSF is correctly considered, CSF was found to partially shield brain tissues from the incident RF field. | |
 |
[73]
Challenges and strategies for the visual exploration of complex environmental data
International Journal of Digital Earth Vol. 10 No. 10 pp. 1070-1076 2017 [DOI: 10.1080/17538947.2017.1327618] [paper] |
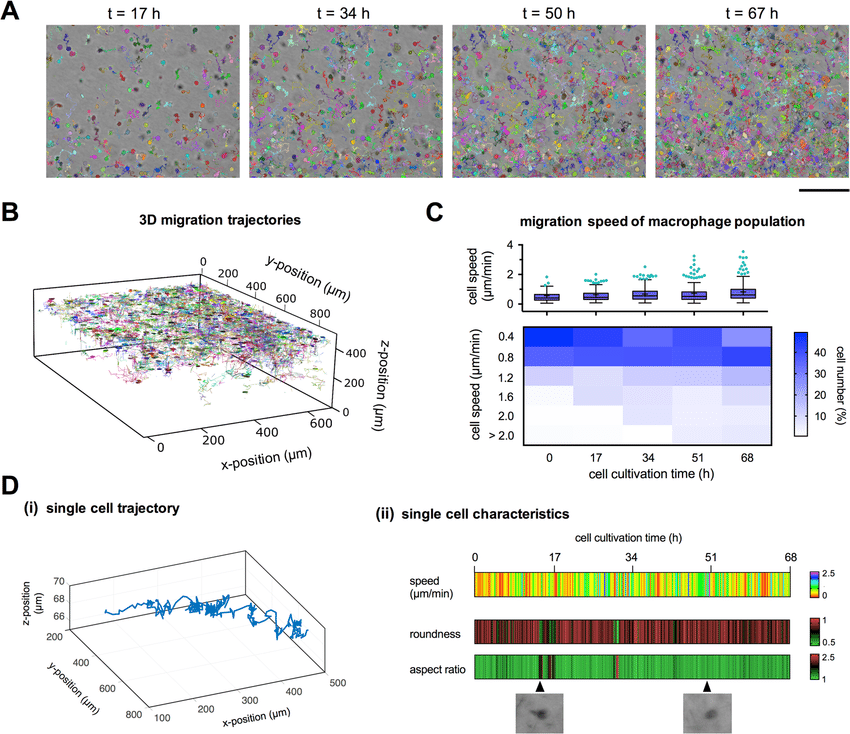
| Abstract: In this opinion paper, we, a group of scientists from environmental-, geo-, ocean- and information science, argue visual data exploration should become a common analytics approach in Earth system science due to its potential for analysis and interpretation of large and complex spatio-temporal data. We discuss the challenges that appear such as synthesis of heterogeneous data from various sources, reducing the amount of information and facilitating multidisciplinary, collaborative research. We argue that to fully exploit the potential of visual data exploration, several bottlenecks and challenges have to be addressed: providing an efficient data management and an integrated modular workflow, developing and applying suitable visual exploration concepts and methods with the help of effective and tailored tools as well as generating and raising the awareness of visual data exploration and education. We are convinced visual data exploration is worth the effort since it significantly facilitates insight into environmental data and derivation of knowledge from it. | |
 |
[72]
Quantitative label-free single cell tracking in 3D biomimetic matrices
Scientific Reports Vol. 7 No. 1 pp. 14135 November 2017 [DOI: 10.1038/s41598-017-14458-x] [paper] |
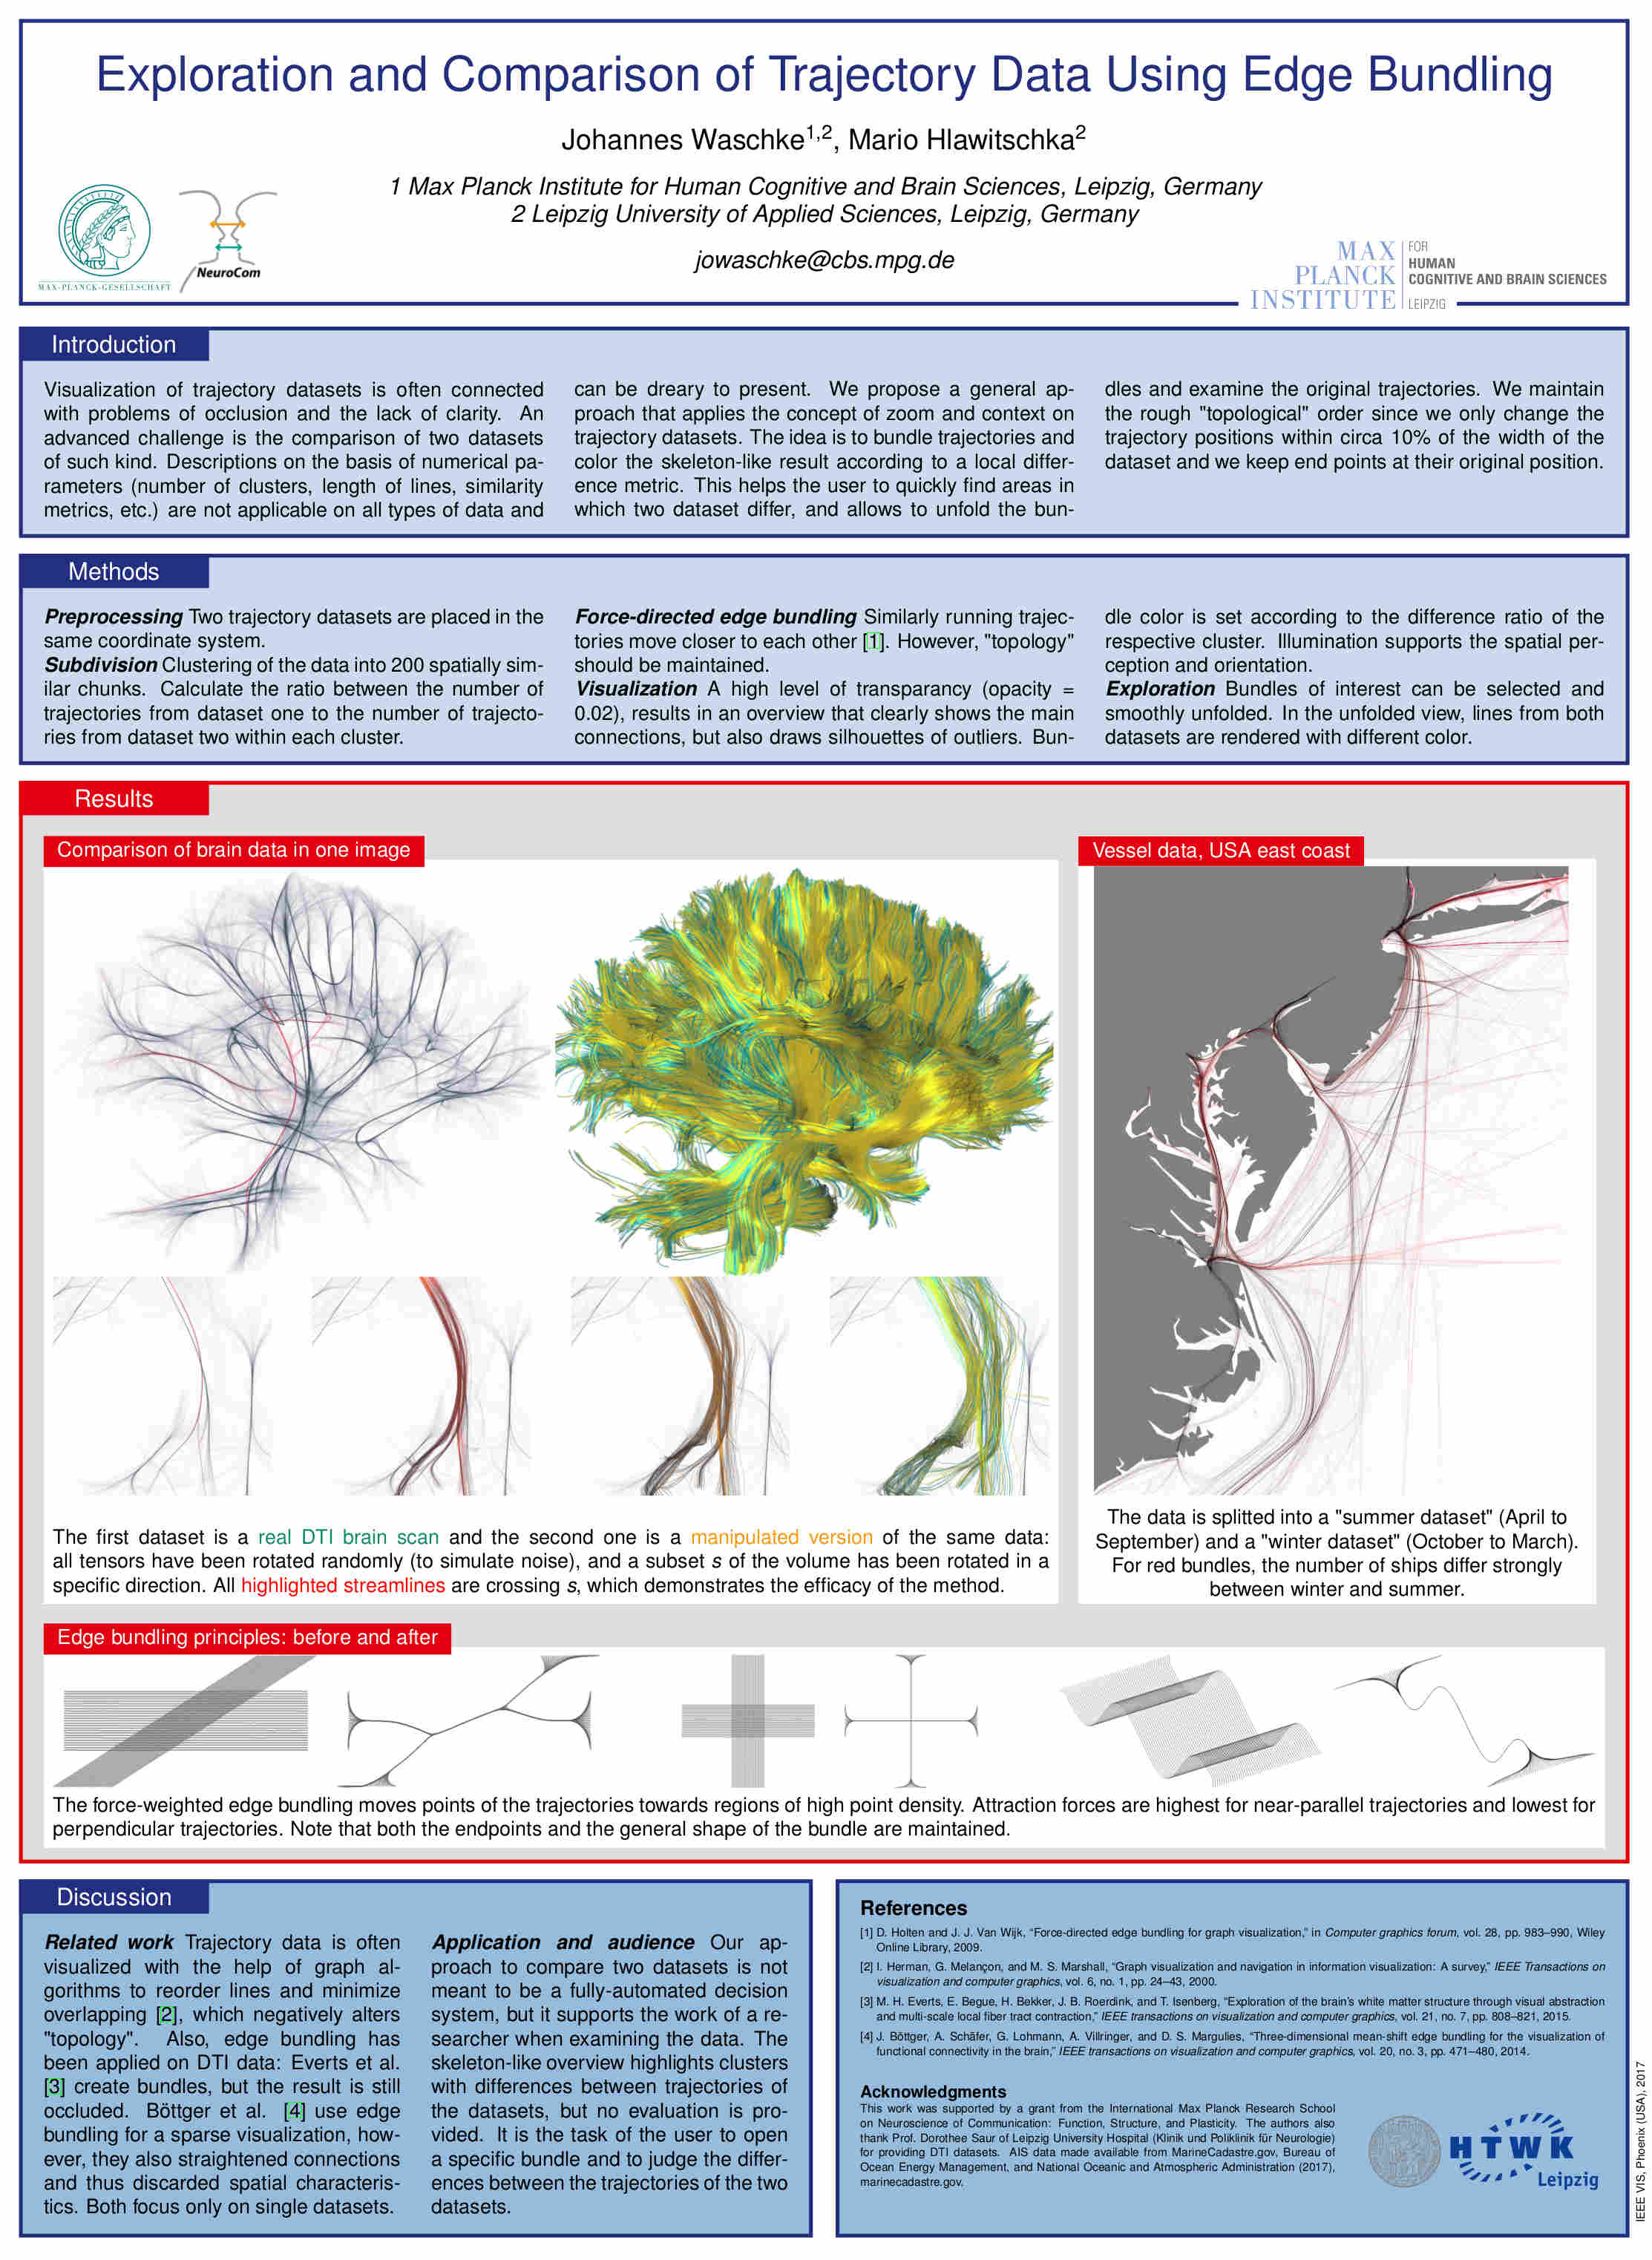
| Abstract: Live cell imaging enables an observation of cell behavior over a period of time and is a growing field in modern cell biology. Quantitative analysis of the spatio-temporal dynamics of heterogeneous cell populations in three-dimensional (3D) microenvironments will contribute a better understanding of cell-cell and cell-matrix interactions for many biomedical questions of physiological and pathological processes. However, current live cell imaging and analysis techniques are frequently limited by non-physiological 2D settings. Furthermore, they often rely on cell labelling by fluorescent dyes or expression of fluorescent proteins to enhance contrast of cells, which frequently affects cell viability and behavior of cells. In this work, we present a quantitative, label-free 3D single cell tracking technique using standard bright-field microscopy and affordable computational resources for data analysis. We demonstrate the efficacy of the automated method by studying migratory behavior of a large number of primary human macrophages over long time periods of several days in a biomimetic 3D microenvironment. The new technology provides a valuable platform for long-term studies of single cell behavior in 3D settings with minimal cell manipulation and can be implemented for various studies regarding cell-matrix interactions, cell-cell interactions as well as drug screening platform for primary and heterogeneous cell populations. | |
 |
[71]
Exploration and Comparison of Trajectory Data
IEEE Vis Posters October 2017 [paper] |
| Abstract: Full rendering of a high number of trajectories (e.g. streamline tractograms of DTI images, or traffic routes) leads to heavy occlusion and superimposition, which reduces the perception of the main characteristics of the data. Evaluation and exploration can therefore be a challenge for the user. These difficulties of understanding are exacerbated when two datasets, like data from different time points, should be compared. We present a method to facilitate the navigation through trajectory sets and enable comparison of two datasets in one image. We minimize occlusion by bundling the trajectories, resulting in a skeleton-like representation, and allow the user to interactively explore regions of interest in detail. | |
| 2016 | |
 |
[70]
Identifying Linear Vector Fields on 2D Manifolds
Computer Science Research Notes, WSCG, International Conferences in Central Europe on Computer Graphics, Visualization and Computer Vision 2016 [ISSN: ISSN 2464-4617][ISBN: 978-80-86943-57-2] [Preprint PDF] |
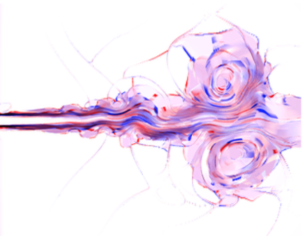
| Abstract: Local linearity of vector fields is a property that is well researched and understood. Linear approximation can be used to simplify algorithms or for data reduction. Whereas the concept is easy to implement in 2D and 3D, it loses meaning on manifolds as linearity has either to be defined based on an embedding in a higher-dimensional Cartesian space or on a map. We present an adaptive atlas-based vector field decomposition to solve the problem on manifolds and present its application on synthetic and climate data. | |
 |
[69]
Comparing Finite-Time Lyapunov Exponents in Approximated Vector Fields
In Carr H., Garth C. Weinkauf T. (editor): Topological Methods in Data Analysis and Visualization IV, Theory, Algorithms, and Applications; Workshop on Topology in Visualization, TopoInVis 2015 , Springer International Publishing AG pp. 267-281 2016 [ISBN13: 978-3-319-44682-0] [DOI: 10.1007/978-3-319-44684-4_16] [Preprint] |
| Abstract: In the context of fluid mechanics, larger and larger flow fields arise. The analysis of such fields on current work stations is heavily restricted by memory. Approximation limits this problem. In this paper, we discuss the impact of vector field approximation on visualization techniques on the example of Finite-Time Lyapunov Exponent (FTLE) computations. Thereby, we consider the results of three different vector field compression approaches and analyze the reliability of integration results as well as their impact on two different FTLE variants. | |
 |
[68]
Topology-Inspired Galilean Invariant Vector Field Analysis
Proceedings of the 2016 IEEE Pacific Visualization Symposium (PacificVis), Taipei pp. 72–79 2016 [DOI: 10.1109/PACIFICVIS.2016.7465253] [ISSN: 2165-8773] [Online PDF] [Preprint PDF] |
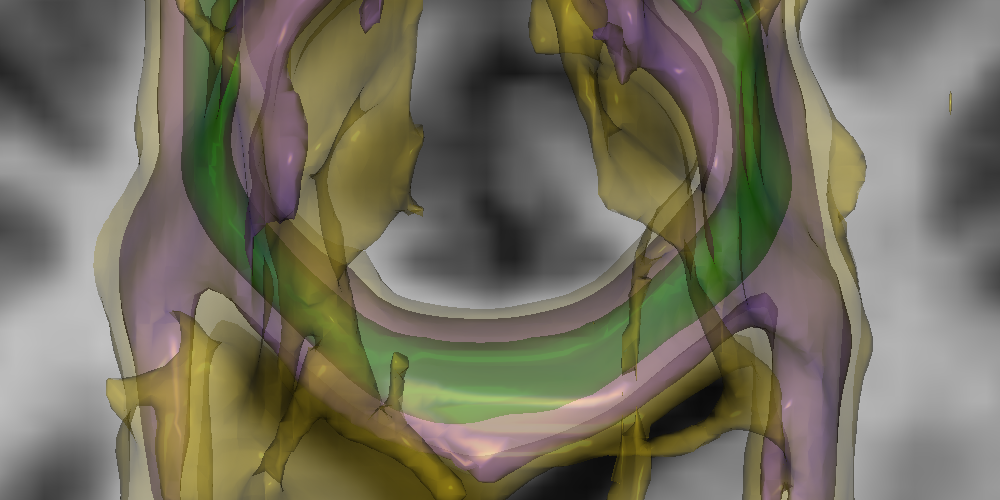
| Abstract: Vector field topology is one of the most powerful flow visualization tools, because it can break down huge amounts of data into a compact, sparse, and easy to read description with little information loss. It suffers from one main drawback though: The definition of critical points, which is the foundation of vector field topology, is highly dependent on the frame of reference. In this paper we propose to consider every point as a critical point and locally adjust the frame of reference to the most persistent ones, that means the extrema of the determinant of the Jacobian. The result is not the extraction of one well-suited frame of reference, but the simultaneous visualization of the dominating frames of reference in the different areas of the flow field. Each of them could individually be perceived by an observer traveling along these critical points. We show all important ones at once. | |
 |
[67]
Multi-modal visualization of probabilistic tratography
Visualization in Medicine and Life Sciences, Progress and New Challenges , Springer Verlag , Berlin/Heidelberg, Germany pp. 195-218 2016 [DOI: 10.1007/978-3-319-24523-2_9] [Online PDF] [conference] |
| Abstract: Neuroscientists use visualizations of diffusion data to analyze neural tracts of the brain. More specifically, probabilistic tractography algorithms reconstruct tracts in such diffusion data and need proper visualization. One problem neuroscientists are facing with probabilistic data is putting this information in context. Neuroscience experts already successfully utilized several techniques together with structural MRI to detect neural tracts in the living human brain which were previously only known from tracer studies in macaque monkeys. Whereas the combination with structural MRI, i.e., T1 and T2 images, has been important for these studies, new challenges ask for an integration of other imaging modalities. First, we provide an overview of the currently used techniques. Then, we show how probabilistic tractography can be combined with other techniques, trying to find new and useful visualizations for multi-modal data. | |
 |
[66]
A Survey of Topology-based Methods in Visualization
Computer Graphics Forum Vol. 35 Issue. 3 pp. 643-667 June 2016 [DOI: 10.1111/cgf.12933] |
| Abstract: This paper presents the state of the art in the area of topology-based visualization. It describes the process and results of an extensive annotation for generating a definition and terminology for the field. The terminology enabled a typology for topological models which is used to organize research results and the state of the art. Our report discusses relations among topological models and for each model describes research results for the computation, simplification, visualization, and application. The paper identifies themes common to subfields, current frontiers, and unexplored territory in this research area. | |
| 2015 | |
 |
[65]
An R-based function for modeling of end member compositions
Mathematical Geosciences Vol. 47 Issue. 8 pp. 1-13 2015 [DOI: 10.1007/s11004-015-9609-7] [paper] [journal] |
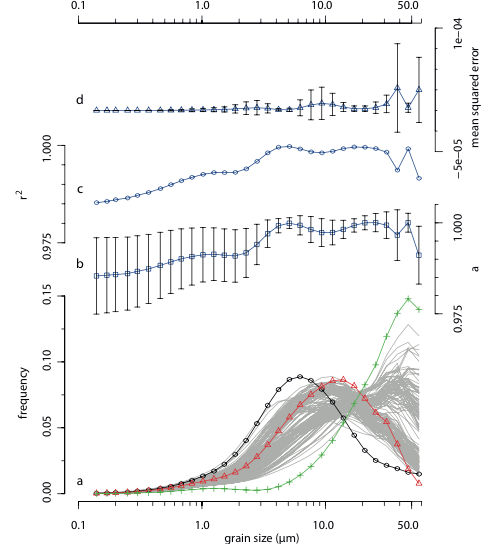
| Abstract: Clastic sediment grains have been exposed to numerous physical and chemical processes during erosion, transport and accumulation. It is widely accepted that weathering and sorting processes are strongly controlled by climate, making grain size distributions a potential recorder for paleoenvironmental conditions. Polymodal grain size distributions of sediments are in general a result of mixing of unimodal grain size distributions (end members) from different sources. Thus, unmixing of polymodal grain size distributions into their unimodal end member compositions (end member modeling) provides a powerful method for revealing sediment sources and environmental conditions of the past. Since the early 1960s several algorithms for unmixing of such compositional data were published. However no source code is available in a modern open access programming language. This study provides an algorithm and some additional functions for the decomposition of grain size distribution data into end member compositions based on a free available statistical programming language. To prove the functionality of the algorithm an end member model of grain size distributions of a piston core from the eastern Mediterranean Sea was calculated. | |
 |
[64]
V-Bundles: Clustering Fiber Trajectories from Diffusion MRI in Linear Time
Medical Image Computing and Computer-Assisted Intervention – MICCAI 2015 , Springer pp. 191-198 2015 [ISBN13: 978-3319245737][ISBN: 3319245732] [Preprint PDF] [video] |
| Abstract: Fiber clustering algorithms are employed to find patterns in the structural connections of the human brain as traced by tractography algorithms. Current clustering algorithms often require the calculation of large similarity matrices and thus do not scale well for datasets beyond 100,000 streamlines. We extended and adapted the 2D vector field k-means algorithm of Ferreira et al. to find bundles in 3D tractography data from diffusion MRI (dMRI) data. The resulting algorithm is linear in the number of line segments in the fiber data and can cluster large datasets without the use of random sampling or complex multipass procedures. It copes with interrupted streamlines and allows multisubject comparisons. | |
 |
[63]
Visualization of Crossing Probabilistic Tracts
IEEE Visualization Awarded as honorable mention by the best poster committee. pp. 147-148 10 2015 |
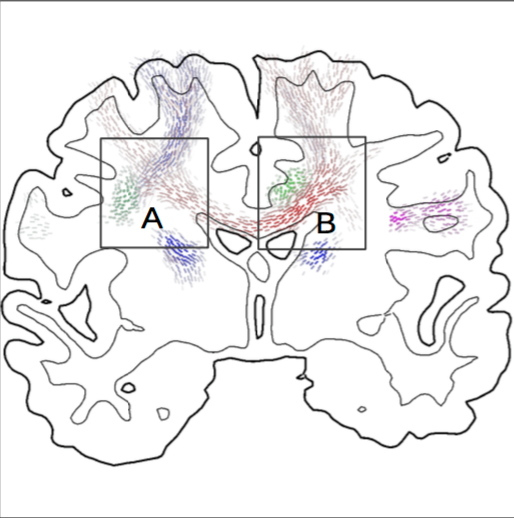
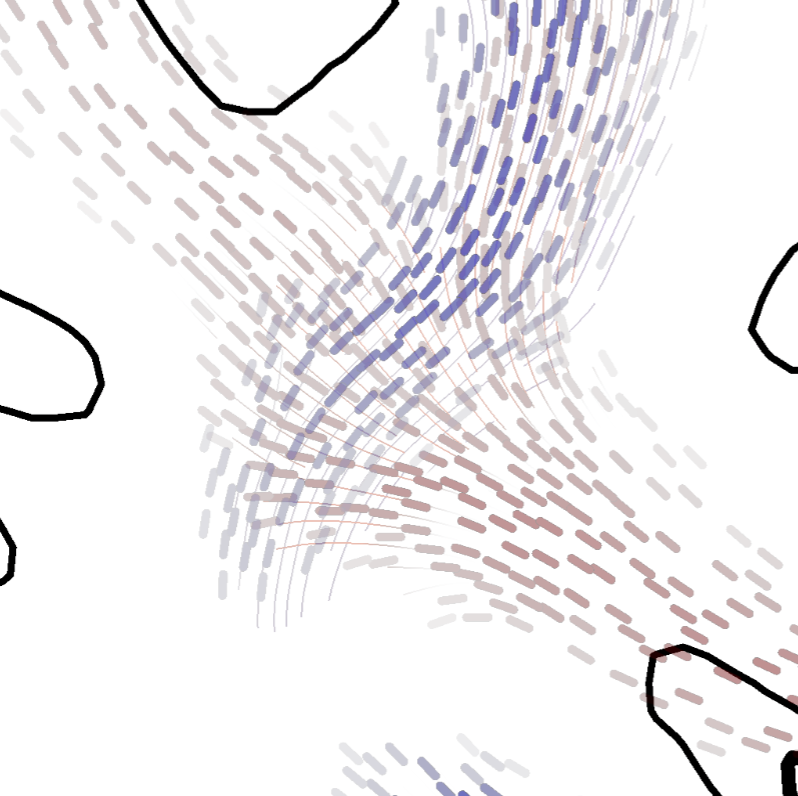 |
[62]
Fiber Stipples for Crossing Tracts in Probabilistic Tractography
Proceedings of VCBM pp. 113-122 10 2015 [Preprint PDF] [conference] |
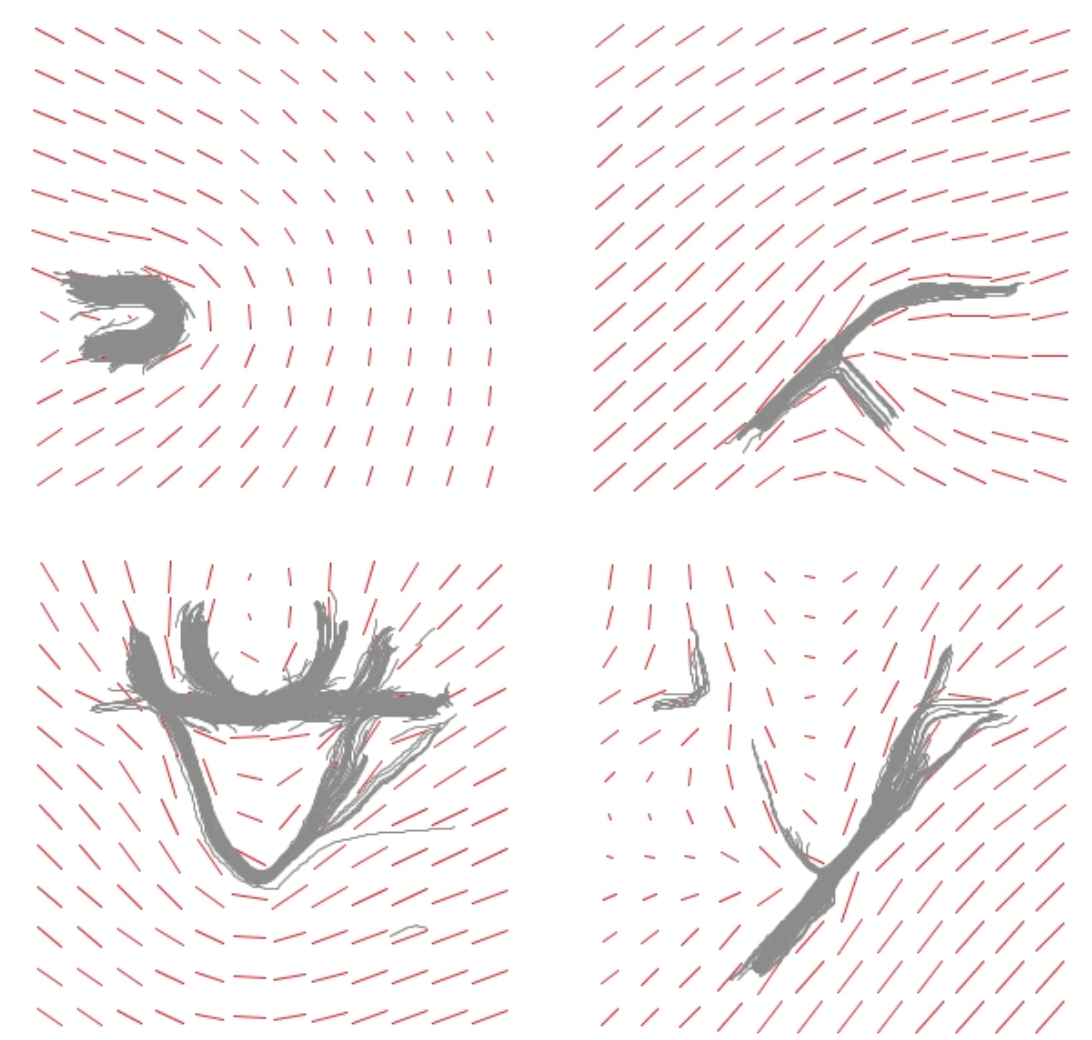
| Abstract: Given diffusion weighted magnetic resonance (dMRI) data, tractography methods may reconstruct estimations of neural connections of the human brain, so called tractograms. Probabilistic tractography algorithms generate a scalar value for each point of the brain, which describes the confidence of an existing structural connection to a predefined seed region. Recently presented Fiber-Stippling is a promising tool to effectively visualize such scalar values on axis aligned cutting planes. However, Fiber-Stippling only works with principal diffusion directions and cannot handle complex tract configurations, such as overlapping or crossing tracts, which are very important to neuroscience. In this work we present an illustrative technique for probabilistic tracts in such configurations, which is based on Fiber-Stippling. Our technique supports multiple diffusion directions as given by high angular resolution diffusion images (HARDI) and hence can visualize crossing tracts, while preserving all of the advantages of Fiber-Stippling. We solve this by visually supporting the stipples, while not altering the original visualization metaphor. Our work is an important contribution to adequate visualization of neuroanatomy, as crossing tracts are a frequent phenomena inside of the human brain. Moreover, our technique may be customized to crossing line fields in general. | |
 |
[61]
2D Vector Field Approximation using Linear Neighborhoods
The Visual Computer , Springer Berlin Heidelberg Vol. 32 Issue. 12 pp. 1563-1578 7 2015 [DOI: 10.1007/s00371-015-1140-9] [ISSN: 1432-2315] [paper] |
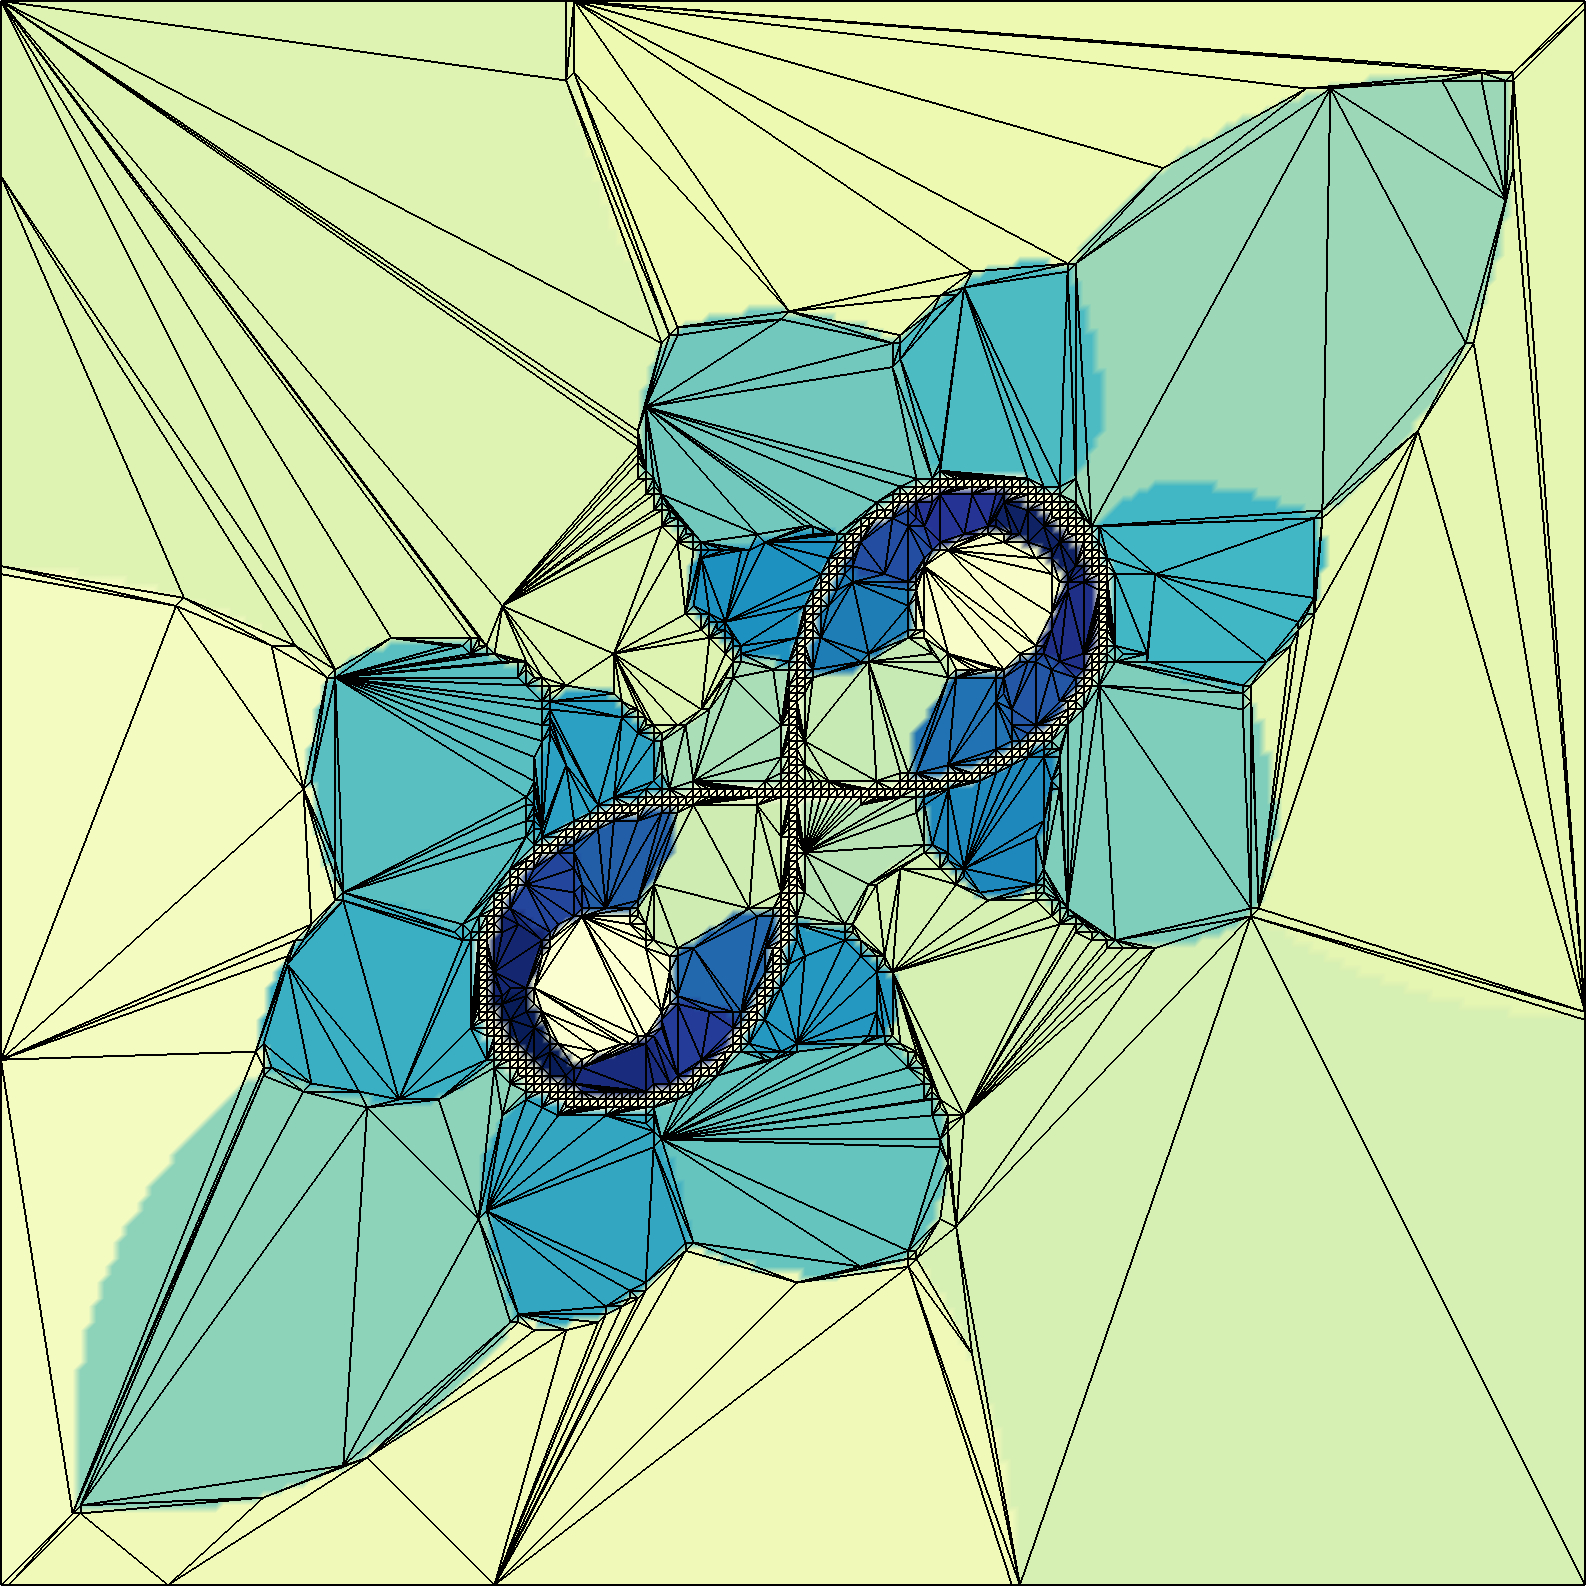
| Abstract: We present a vector field approximation for two-dimensional vector fields that preserves their topology and significantly reduces the memory footprint. This approximation is based on a segmentation. The flow within each segmentation region is approximated by an affine linear function. The implementation is driven by four aims: 1. the approximation preserves the original topology; 2. the maximal approximation error is below a user-defined threshold in all regions; 3. the number of regions is as small as possible; 4. each point has the minimal approximation error. The generation of an optimal solution is computationally infeasible. We discuss this problem and provide a greedy strategy to efficiently compute a sensible segmentation that considers the four aims. Finally, we use the region-wise affine linear approximation to compute a simplified grid for the vector field. | |
 |
[60]
Augmented representations of clustered fiber bundles for interactive queries
iV2015 - 19th International Conference Information Visualisation, Barcelona, Spain pp. 530-535 7 2015 [conference] |
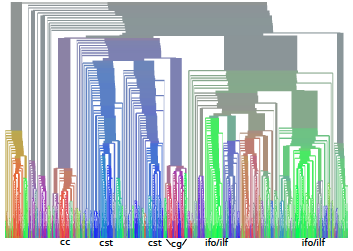
| Abstract: Hierarchical fiber clustering is a promising way to analyze brain connectivity. A disadvantage of hierarchical fiber clustering is its difficult visualization. The simple presentation as a 2D tree is because of the amount of several thousand leaves visually too complex. We present a framework that allows the modification of the dendrogram visualization in a flexible way. The modified dendrogram visualization can convey additional information that grant an easier orientation within the hierarchical clustering. Beside the interaction with the dendrogram itself, it is also possible to make use of a 3D view and a clustering preview. To illustrate potential use cases, we present two usage examples that show the versatility of our framework. | |
| 2014 | |
 |
[59]
Combined Three-Dimensional Visualization of Structural Connectivity and Cortex parcellation
VMV 2014: Vision, Modeling & Visualization, Darmstadt, Germany, 2014. Proceedings pp. 71-78 2014 [DOI: 10.2312/vmv.20141278] [paper] [conference] |
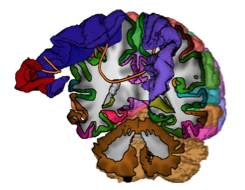
| Abstract: The human cortex is organized in spatially distinct regions of different functional units. Cortex parcellations based on magnetic resonance imaging (MRI) of living human subjects are common practice, and recently, structural connectivity from diffusion weighted resonance imaging (dwMRI) have been successfully applied to generate such parcellations. The exploration of structural connectivity data together with cortex parcellations has proven to be challenging due to overlapping tracts and structures, limited depth perception, and the large number of tracts, which clutter the visualization. However, the involvement of structural connectivity forces such visualizations to act in anatomical space. While structural connectivity can be communicated using three-dimensional or slice- based visualizations, cortex parcellations are visualized on three-dimensional surfaces. In this work, we solve this problem by proposing an interactive illustrative 3D visualization for both structural connectivity data and cortex parcellations in anatomical space. We achieve this by providing an abstract visualization of the structural connectivity while still being able to provide the full detail on demand. Our visualization furthermore employs interactivity and illustrative depth-enhancing, which are supported by anatomical context and textual annotations and thus help the user to build a mental map of the connections in the brain. Functional and effective connectivity might benefit from such a combined visualization as they use cortex parcellations as well. | |
 |
[58]
Cover for Discoveries 2014
Discoveries, innovations in research, health care and education, Volume 5/2014, UC San Diego Health Sciences 2014 [paper] |
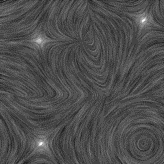
| Abstract: Fibrous neural connections are depicted in this tractograph of a human brain. The technique maps the flow of water molecules inside and outside of neurons using multiple imaging technologies and computer analyses, producing a three-dimensional rendering for use in diagnoses and treatment. | |
 |
[57]
Customized TRS Invariants for 2D Vector Fields via Moment Normalization
Pattern Recognition Letters Vol. 46 pp. 46-59 2014 [DOI: 10.1016/j.patrec.2014.05.005] [journal] |
| Abstract: The behavior of vector fields under translation, rotation and scaling differs with respect to the underlying application. Moment invariants that are customized to the specific problem can be constructed by means of normalization. In this paper, we calculate general TRS (translation, rotation, and scaling) moment invariants for two-dimensional vector fields. As an example, we show explicitly how to customize the result for the detection of flow field patterns. | |
 |
[56]
A comparative evaluation of electrical field visualization from EEG/tDCS
NeuroImage, Organization for Human Brain Mapping, Annual Meeting, 2014 Vol. 101 pp. 513-530 2014 [paper] [conference] |
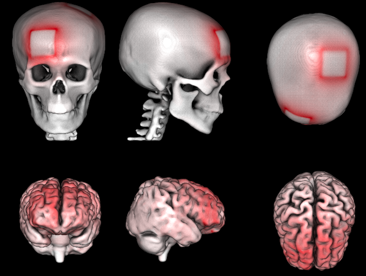
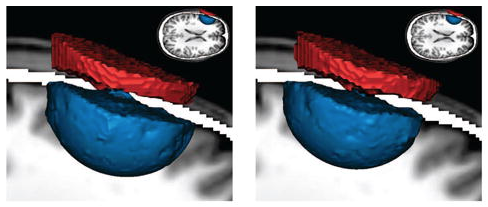
| Abstract: Background / Purpose: In this work, we evaluate several standard visualization techniques in their applicability on electrical fields from EEG and tDCS in the human brain. Main conclusion: Most applications profit from visualization, but the used visualization technique is heavily use-case dependent and needs to be chosen with care. Electrical activity of neuronal populations is a crucial aspect of brain activity. This activity is not measured directly but recorded as electrical potential changes using head surface electrodes (electroencephalogram - EEG). Head surface electrodes can also be deployed to inject electrical currents in order to modulate brain activity (transcranial direct current stimulation, tDCS) for therapeutic purposes. For EEG and tDCS, electrical fields mediate between electrical signal sources and regions of interest (ROI). These fields can be very complicated in structure, and are influenced in a complex way by the conductivity profile of the human head. Visualization techniques play a central role to grasp the nature of those fields because such techniques allow for an effective conveyance of complex data and enable quick qualitative and quantitative assessments. However, not every visualization technique is equally adequate for different analysis tasks and types of data. Additionally, the vast amount of available techniques makes it hard to decide for an optimal visualization approach. This often leads to color mapped slices as known-to-work default option, which often is suboptimal for the analysis of the data. Here, we evaluate a number of widely used visualization techniques for EEG and tDCS data. We assess volume (DVR, [2]) and surface (Isosurfaces, [3]) visualization, streamlines and line integral convolution (LIC, [1]) for their applicability, pros, and cons in EEG and tDCS electrical field data. In particular, we focus on the extractability of quantitative and qualitative information from the obtained images, their effective integration of anatomical context information, and their interaction. We where able to identify the certain pros and cons of each method, and described the findings in each example with the different visualization methods. During our evaluation, we found that we can divide the visualization techniques into two categories. 1) Visualization of local details (LIC). These methods usually profit from high grade of detail and optimal combination with other, color-coded information, but they suffer a missing spatial embedding. 2) Visualization of global structural information (Streamlines, volume and surface rendering). These methods provide insight into large scale effects and electrical field properties, including spatial correlations in the data. Unfortunately, these methods tend to suffer from the visual occlusion problem and the difficult embedding into contextual (also anatomical) data. This means, there are visualization methods available for every kind of analysis and data, but they have to be chosen appropriately to really provide additional insight into the data. | |
 |
[55]
Visualizing Simulated Electrical Fields from Electroencephalography and Transcranial Electric Brain Stimulation: A Comparative Evaluation
NeuroImage 2014 [DOI: 10.1016/j.neuroimage.2014.04.085] [Preprint] [journal] [PMID: 24821532] |
| Abstract: Electrical activity of neuronal populations is a crucial aspect of brain activity. This activity is not measured directly but recorded as electrical potential changes using head surface electrodes (electroencephalogram - EEG). Head surface electrodes can also be deployed to inject electrical currents in order to modulate brain activity (transcranial electric stimulation techniques) for therapeutic and neuroscientific purposes. In electroencephalography and noninvasive electric brain stimulation, electrical fields mediate between electrical signal sources and regions of interest (ROI). These fields can be very complicated in structure, and are influenced in a complex way by the conductivity profile of the human head. Visualization techniques play a central role to grasp the nature of those fields because such techniques allow for an effective conveyance of complex data and enable quick qualitative and quantitative assessments. The examination of volume conduction effects of particular head model parameterizations (e.g., skull thickness and layering), of brain anomalies (e.g., holes in the skull, tumors), location and extent of active brain areas (e.g., high concentrations of current densities) and around current injecting electrodes can be investigated using visualization. Here, we evaluate a number of widely used visualization techniques, based on either the potential distribution or on the current-flow. In particular, we focus on the extractability of quantitative and qualitative information from the obtained images, their effective integration of anatomical context information, and their interaction. We present illustrative examples from clinically and neuroscientifically relevant cases and discuss the pros and cons of the various visualization techniques. | |
 |
[54]
Chapter: Mathematical Foundations of Uncertain Field Visualization
In Hansen, C.D., Chen, M., Johnson, C.R., Kaufman, A.E., Hagen, H. (editors): Scientific Visualization — Uncertainty, Multifield, Biomedical, and Scalable Visualization , Spinger-Verlag London pp. 95-102 2014 [ISBN: 978-1-4471-6497-5] [DOI: 10.1007/978-1-4471-6497-5] [ISSN: 1612-3786] [paper] |
| Abstract: Uncertain field visualization is currently a hot topic as can be seen by the overview in this book. This article discusses a mathematical foundation for this research. To this purpose, we define uncertain fields as stochastic processes. Since uncertain field data is usually given in the form of value distributions on a finite set of positions in the domain, we show for the popular case of Gaussian distributions that the usual interpolation functions in visualization lead to Gaussian processes in a natural way. It is our intention that these remarks stimulate visualization research by providing a solid mathematical foundation for the modeling of uncertainty. | |
 |
[53]
cuSwift - a suite of numerical integration methods for modelling planetary systems implemented in C/CUDA
12th Asteroids, Comets, Meteors Conference, Helsinki, Finland, July 4th, 2014 2014 [Preprint PDF] [paper] |
| Abstract: Simulations of dynamical processes in planetary systems represent an important tool for studying their orbital evolution. Using modern numerical integration methods, it is possible to model systems containing many thousands of objects over time scales of several hundred million years. However, in general supercomputers are needed to get reasonable simulation results in acceptable execution times. To exploit the ever growing computation power of Graphics Processing Units (GPUs) in modern desktop computers we implemented cuSwift, a library of numerical integration methods for studying long- term dynamical processes in planetary systems. cuSwift can be seen as a re-implementation of the famous SWIFT integrator package written by Hal Levison and Martin Duncan. cuSwift is written in C/CUDA and contains different integration methods for various purposes. So far, we have implemented three algorithms: a 15th order Radau integrator, the Wisdom-Holman Mapping (WHM) integrator and the Regularized Mixed Variable Symplectic (RMVS) Method. These algorithms treat only the planets as mutually gravitationally interacting bodies whereas asteroids and comets (or other minor bodies of interest) are treated as massless test particles which are gravitationally influenced by the massive bodies but do not affect each other or the massive bodies. The main focus of this work is on the symplectic methods (WHM and RMVS) which use a larger time step and thus are capable of integrating many particles over a large time span. As an additional feature, we implemented the non-gravitational Yarkovsky effect as described by M. Bro\^z. With cuSwift we show that the use of modern GPUs makes it possible to speed up these methods by more than one order of magnitude compared to the single-core CPU implementation, thereby enabling modest workstation computers to perform long-term dynamical simulations. We use these methods to study the influence of the Yarkovsky effect on resonant asteroids. We present first results and compare them with integrations done with the original algorithms implemented in SWIFT in order to assess the numerical precision of cuSwift and to demonstrate the speedup we achieved using the GPU. | |
 |
[52]
Choosing a tractography algorithm: On the effects of measurement noise
In Schultz, Th., Nedjati-Gilani, G, Venkataraman, A., O'Donnell, L., Panagiotaki, E (editors): MICCAI Workshops, Nagoya, Japan, September 22nd, 2013 , Springer pp. 115-128 2014 [ISBN: 978-3-319-02474-5] |
| Abstract: Diffusion MRI Tractography has evolved into a widely used, important tool within neurosiences, providing the foundation for in-vivo neuroanatomy and hence for white matter atlas construction and map- ping of structural connectivity in the human brain. This renders it crucially important to understand the influence of the various MRI imaging artifacts on the tractography results. In this paper, we focus on the thermal noise that is present in all MRI measurements and compare its effect on the output of several established tractographic algorithms. We create a reference dataset by denoising with a Non-Local Means filter and evaluate the effect of noise added to the reference on the tractography results with a Monte-Carlo simulation. Those results indicate that for among the algorithms tested, the Tensorlines approach is the most robust for tracking white matter fiber bundles and the Bayes DTI approach should be preferred for calculating gray matter structural connectivity. | |
 |
[51]
Top Challenges in the Visualization of Engineering Tensor Fields
In C.F. Westin, B. Burgeth, A. Vilanova (editors): Visualization and Processing of Tensors and Higher-Order Descriptors for Multi-field Data (Dagstuhl Seminar 11501) , Springer Berlin Heidelberg pp. 3-15 2014 [DOI: 10.1007/978-3-642-54301-2_1] [ISBN: 978-3-642-54301-2][ISSN: 1612-3786] [paper] |
| Abstract: In this chapter we summarize the top research challenges in creating successful visualization tools for tensor fields in engineering. The analysis is based on our collective experiences and on discussions with both domain experts and visualization practitioners. We find that creating visualization tools for engineering tensors often involves solving multiple different technical problems at the same time – including visual intuitiveness, scalability, interactivity, providing both detail and context, integration with modeling and simulation, representing uncertainty and managing multi-fields; as well as overcoming terminology barriers and advancing research in the mathematical aspects of tensor field processing. We further note the need for tools and data repositories to encourage faster advances in the field. Our interest in creating and proposing this list is to initiate a discussion about important research issues within the visualization of engineering tensor fields. | |
| 2013 | |
 |
[50]
Physics of neuroimaging and computational neuroscience. Lecture Methods II. Max Planck Institute for Human Cognitive and Brain Sciences, Leipzig, Germany
online 2013-05-27 - 2013-07-08 2013 [paper] |
 |
[49]
Hierarchical Poisson-Disk Sampling for Fiber Stipples
In Lars Linsen, H.-C. Hege, Bernd Hamann (editors): Eurographics/IEEE-VGTC Symposium on Visualization 2011 , Eurographics pp. 19-23 2013 [DOI: 10.2312/PE.VMLS.VMLS2013.019-023] |
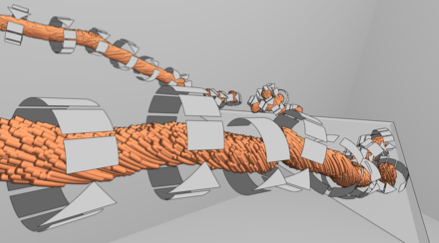
| Abstract: To understand neural tracts of the brain, neuroscientists use visualizations of diffusion data. Fiber stippling - a technique inspired by illustrations - accommodates probabilistic tracts, main diffusion direction, and anatomical context in the same slice image. It uses stratified sampling to place stipples, but this can result in overlaps and undersampled areas that distort the perception of tract probability. Moreover, when changing slices in an interactive setting, resampling leads to visual noise that distracts from real changes in the data. In this paper, we propose to use Poisson-disk samplings to ensure adequate pattern perception inside slices and a hierarchy of samplings to ensure coherence among slices. We also port the algorithm to the GPU to achieve interactive frame rates. Our modifications are appreciated by neuroscientists, who can now investigate white-matter structures more confidently. | |
 |
[48]
Illustrative Rendering of Vortex Cores
Computer Graphics Forum/2013 EG Conference on Visualization pp. 61–65 2013 [DOI: 10.2312/PE.EuroVisShort.EuroVisShort2013.061-065] [journal] |
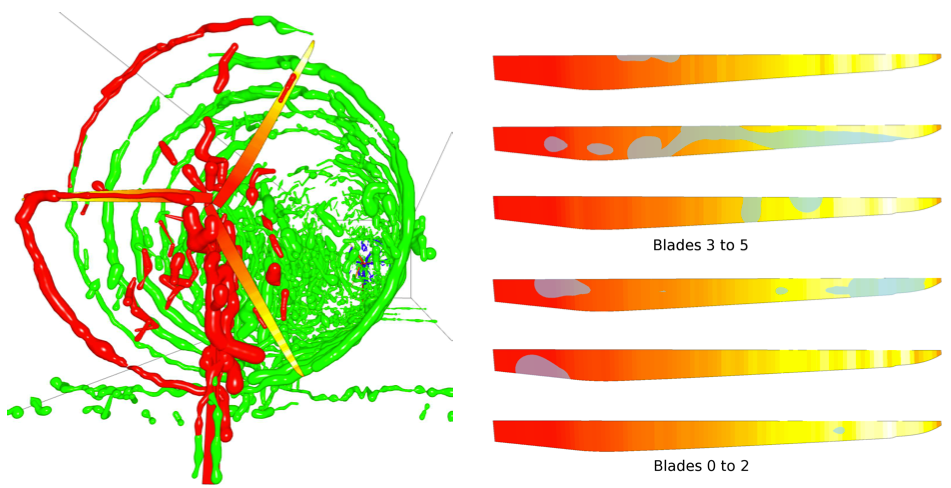
| Abstract: Vortices are singular features crucial for understanding transitional and turbulent flow fields, and have often been visualized using isosurfaces, hulls, and line-like structures. We introduce a novel visualization method that represents these features as illustrative vortex core lines, and show how this illustrative method clearly depicts canonical vortex properties such as direction, rotational strength, spatial extension, and underlying flow behavior simultaneously, unlike standard visualization approaches. Our non-photorealistic vortex core lines leverage the axis and rotational properties of a vortex detector to depict the direction and the rotational strength of vortices, respectively. Furthermore, we extract flow behavior in the vicinity of the vortex cores to provide context for the vortices that we extract. We demonstrate the efficacy of our illustrative vortex extraction framework in two benchmark data sets by showing how they characterize the properties of the examined flow fields. | |
 |
[47]
Visualization and Analysis of Vortex-Turbine Intersections in Wind Farms
IEEE Transactions on Visualization and Computer Graphics, TVCG Vol. 19 No. 9 pp. 1579–1591 2013 [ISSN: 1077-2626] [DOI: 10.1109/TVCG.2013.18] [paper] [PMID: 23420226] |
| Abstract: Characterizing the interplay between the vortices and forces acting on a wind turbine's blades in a qualitative and quantitative way holds the potential for significantly improving large wind turbine design. The paper introduces an integrated pipeline for highly effective wind and force field analysis and visualization. We extract vortices induced by a turbine's rotation in a wind field, and characterize vortices in conjunction with numerically simulated forces on the blade surfaces as these vortices strike another turbine's blades downstream. The scientifically relevant issue to be studied is the relationship between the extracted, approximate locations on the blades where vortices strike the blades and the forces that exist in those locations. This integrated approach is used to detect and analyze turbulent flow that causes local impact on the wind turbine blade structure. The results that we present are based on analyzing the wind and force field data sets generated by numerical simulations, and allow domain scientists to relate vortex-blade interactions with power output loss in turbines and turbine life-expectancy. Our methods have the potential to improve turbine design in order to save costs related to turbine operation and maintenance. | |
 |
[46]
PointAO – Improved Ambient Occlusion for Point-based Visualization
Computer Graphics Forum/2013 EG Conference on Visualization Issue. 99 pp. 13-17 2013 [DOI: 10.2312/PE.EuroVisShort.EuroVisShort2013.013-017] [journal] |
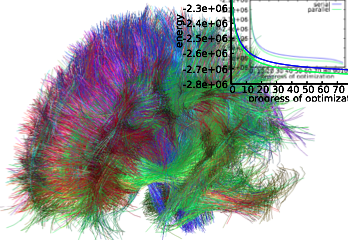
| Abstract: The visualization of large amounts of particles, glyphs, and other point-based data plays an important role in many fields of science, among them flow mechanics, molecular dynamics, and medical imaging. The proper perception of spatial structures and spatial relations in the data is crucial to the understanding. To accommodate this aspect, we utilize and improve an existing ambient occlusion approach, originally tailored towards line rendering and extend the approach to be applicable to point-based visualizations. | |
 |
[45]
Parallelized Global Brain Tractography
In Michael M. Bronstein, Jean Favre, Kai Hormann (editors): VMV; Proceedings of the Vision, Modeling, and Visualization Workshop 2013, Lugano, Switzerland, 2013 , Eurographics Association pp. 97-104 2013 [DOI: 10.2312/PE.VMV.VMV13.097-104] [ISBN: 978-3-905674-51-4] |
| Abstract: Most brain tractography algorithms suffer from lower accuracy, because they use only information in a certain neighborhood and reconstruct the tracts independently. Global brain tractography algorithms compensate the lack of accuracy of those local algorithms in certain areas by optimizing the whole tractogram. The global tractography approach by Reisert et al. showed the best results in the Fiber Cup contest, but the runtime is still a matter for a medical application. In this paper we present the non-trivial parallelization of this global tractography algorithm. The parallelization exploits properties of the algorithm and modifies the algorithm where necessary. We compare the runtimes of the serial and the parallel variant and show that the outcomes of the parallel variant are of the same quality as those of the serial algorithm. The experiments proof also that the parallelization scales well for real world datasets. | |
 |
[44]
Visualizing Linear Neighborhoods in Non-Linear Vector Fields
Proceedings of the 2013 IEEE Pacific Visualization Symposium (PacificVis), Sydney, Australia pp. 249-256 2013 [DOI: 10.1109/PacificVis.2013.6596152] [ISSN: 2165-8765] [Preprint PDF] |
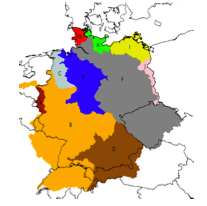
| Abstract: Linear approximation plays an important role in many areas employing numerical algorithms. Particularly in the field of vector field visualization, it is the basis of widely used techniques. In this paper, we introduce two methods to extract areas in two- and three-dimensional vector fields that are connected to linear flow behavior. We propose a region growing algorithm that extracts the linear neighborhood for a certain position. The region is characterized by linear flow behavior up to a user defined approximation threshold. While this first method computes the size of a region given the mentioned threshold, our second method computes the quality of a linear approximation given a user-defined n-ring neighborhood. The scalar field resulting from the second method is therefore called affine linear approximation error. Isosurfaces of this field segment the domain into regions of close-to-linear and non-linear flow behavior. We demonstrate the expressiveness and discuss the properties of the extracted regions using analytical examples and several datasets from the domain of computational fluid dynamics (CFD). | |
 |
[43]
Determining and Visualizing Potential Sources of Floods
In O. Kolditz, K. Rink, G. Scheuermann (editors): Workshop on Visualisation in Environmental Sciences (EnvirVis) , Eurographics Association 2013 [DOI: 10.2312/PE.EnvirVis.EnvirVis13.065-069] [conference] |
| Abstract: In this paper, we visually analyze spatio-temporal patterns of different hydrologic parameters relevant for flooding. On the basis of data from climate simulations with a high resolution regional atmosphere model, several extreme events are selected for different river catchments in Germany. By visually comparing the spatial distribution of the main contributions to the run-off along with their temporal evolution for a time period in the 20th and the 21th century, impacts of climate change on the hydrological cycle can be identified. | |
 |
[42]
LineAO — Improved Three-Dimensional Line Rendering
IEEE Transaction on Visualization and Computer Graphics , IEEE Computer Society , Los Alamitos, CA, USA No. 3 Vol. 19 2013 [DOI: 10.1109/TVCG.2012.142] [ISSN: 1077-2626] [paper] [PMID: 22689079] [youtube] |
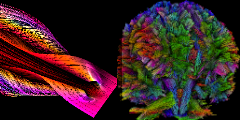
| Abstract: Rendering large numbers of dense three-dimensional lines and curves is a common need for many visualization techniques, including streamlines and fiber tractography. Unfortunately, depiction of spatial relations inside these line bundles is often difficult but critical for understanding the represented structures. Many approaches evolved for solving this problem by providing illumination models or tube-like renderings. Although these methods helped to improve spatial perception of individual lines or related sets of lines, they could not solve this problem entirely. In this paper, we present a novel approach which improves plasticity of line renderings by providing an improved real-time ambient occlusion approach in combination with proper directed illumination. | |
 |
[41]
dPSO-Vis: Topological Visualization of Discrete Particle Swarm Optimization
Computer Graphics Forum, Special Issue , Wiley-Blackwell Vol. 32 Issue. 3pt3 pp. 651-660 6 2013 [DOI: 10.1111/cgf.12122] [paper] |
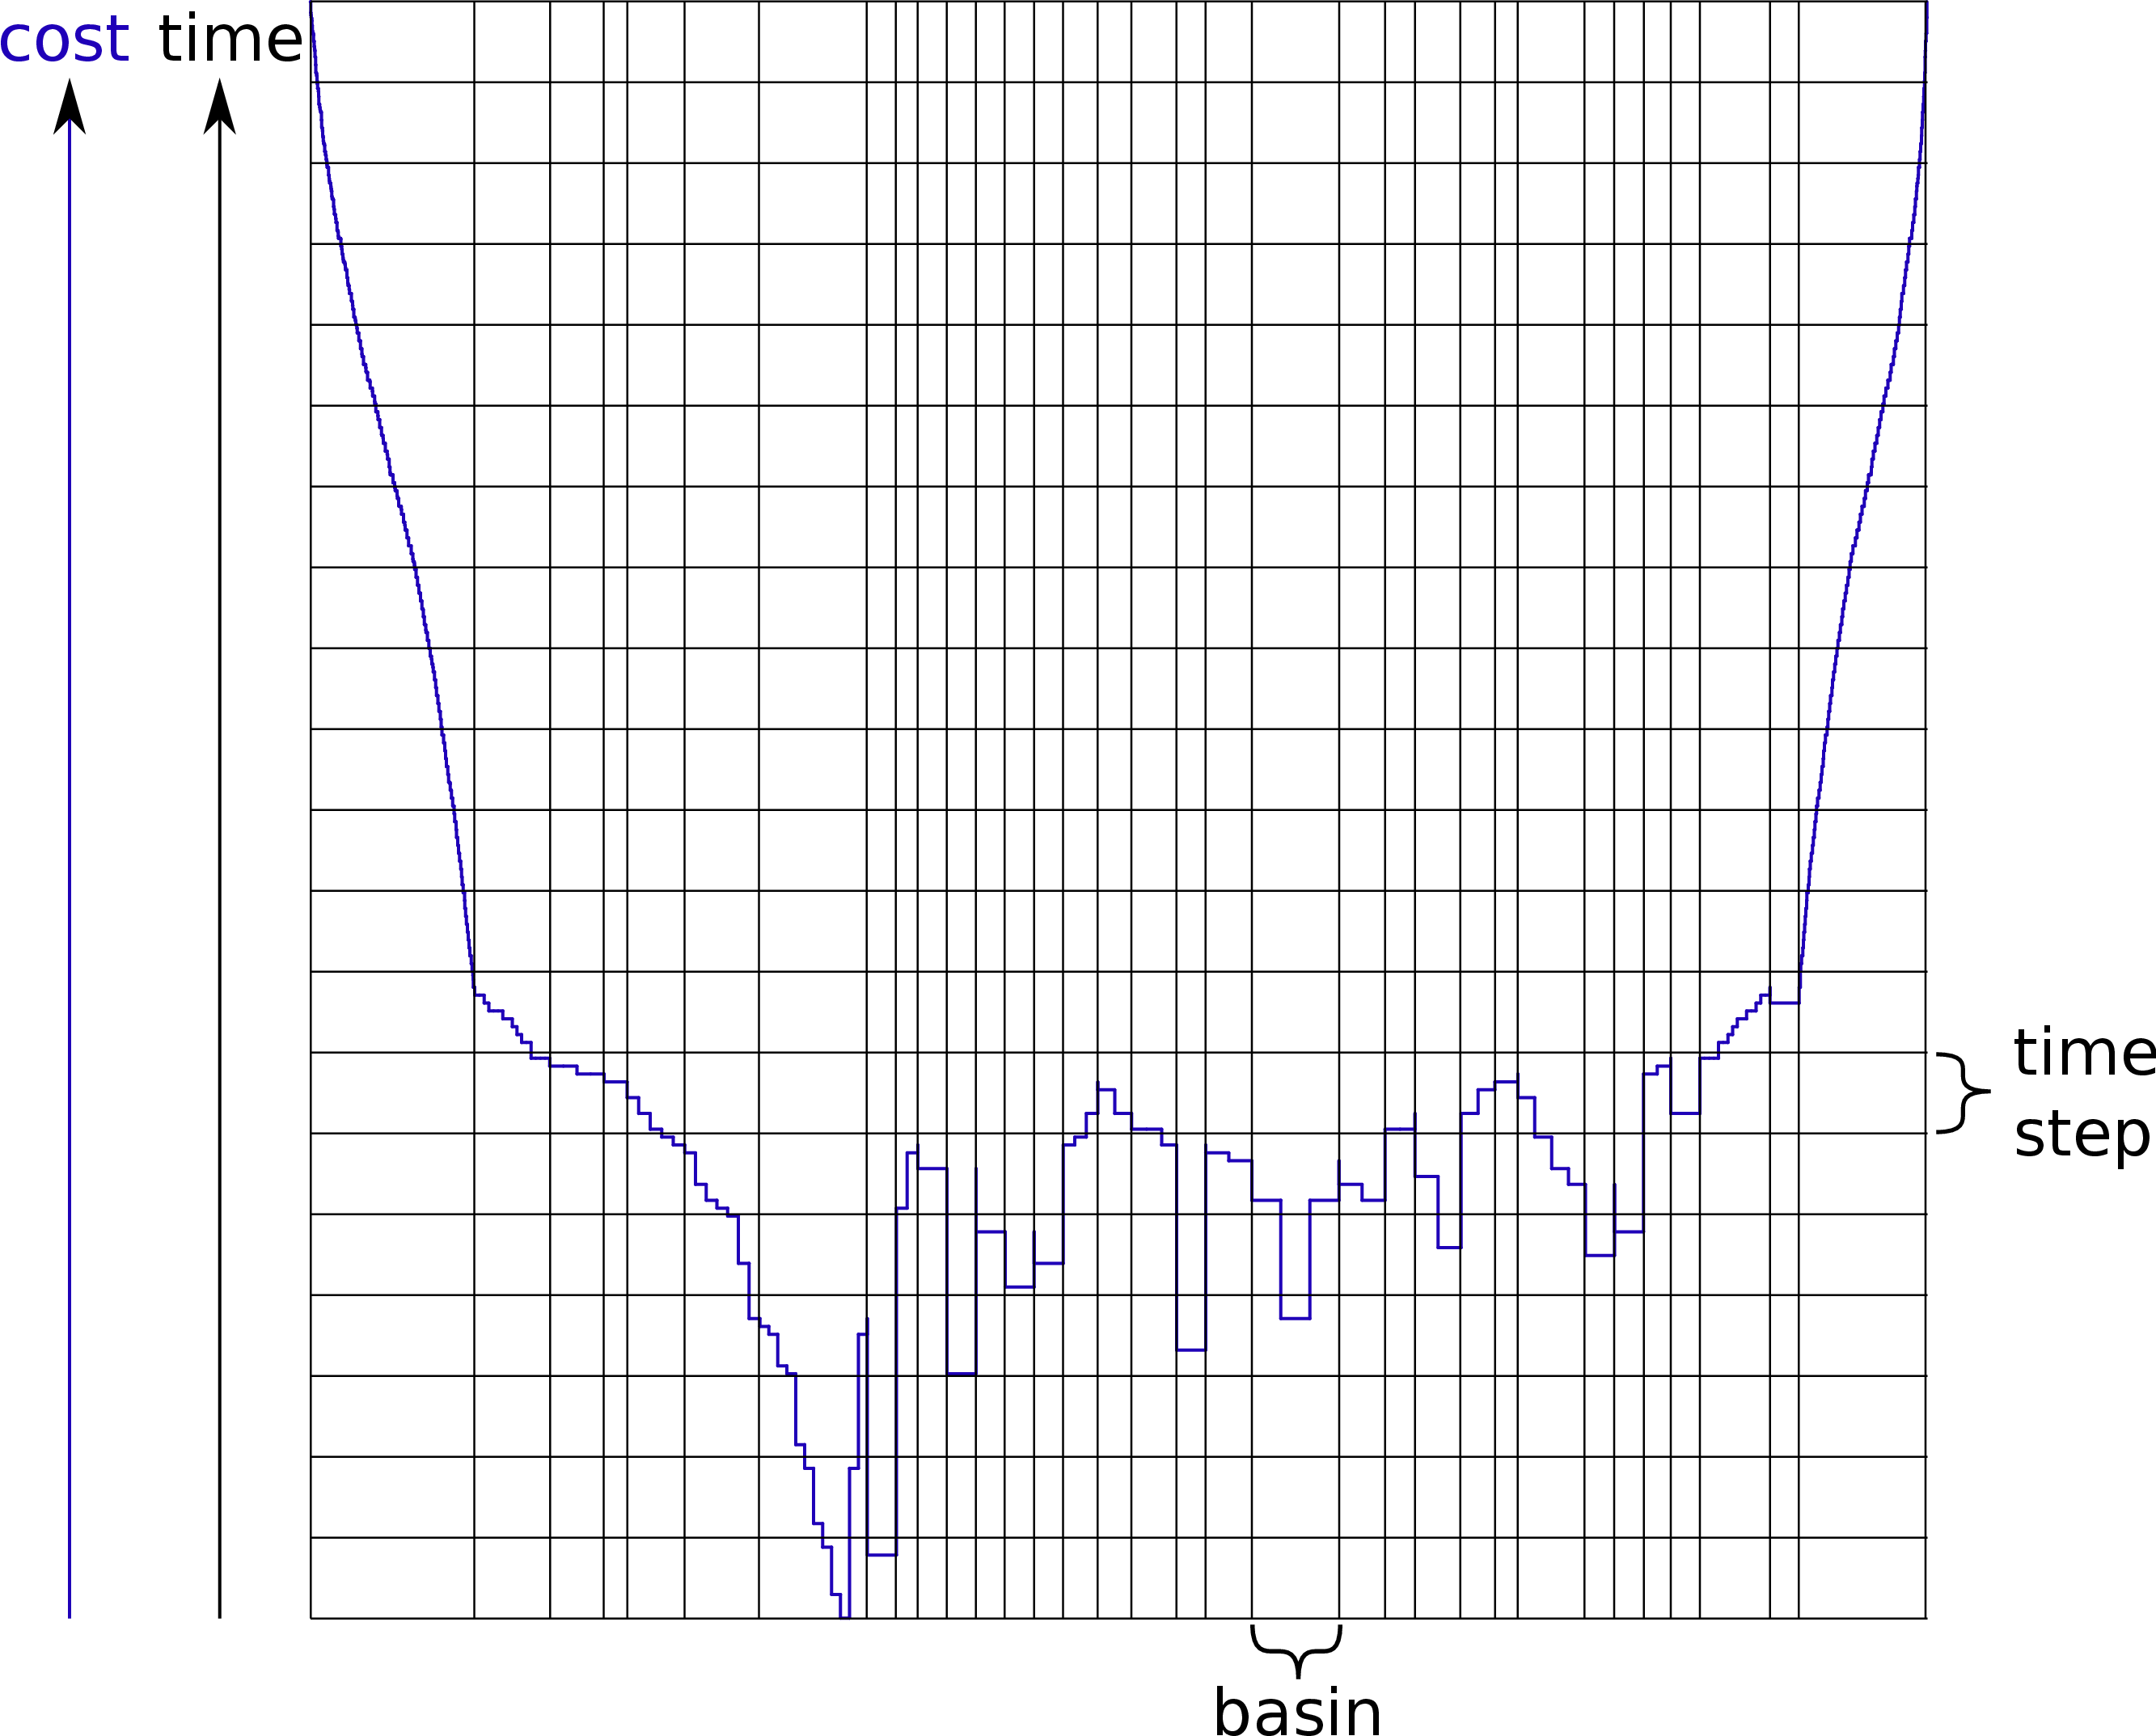
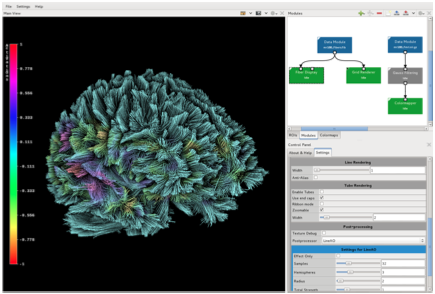
| Abstract: Particle swarm optimization (PSO) is a metaheuristic that has been applied successfully to many continuous and combinatorial optimization problems, e.g., in the fields of economics, engineering, and natural sciences. In PSO a swarm of particles moves within a search space in order to find an optimal solution. Unfortunately, it is hard to understand in detail why and how changes in the design of PSO algorithms affect the optimization behavior. Visualizing the particle states could provide substantially better insight into PSO algorithms, but in case of combinatorial optimization problems, it raises the problem of illustrating the discrete states that cannot easily be embedded spatially. We propose a visualization approach to analyze the optimization problem topologically using a landscape metaphor. Therefore, we transform the configuration space of the optimization problem into a barrier landscape that is topologically equivalent. This visualization is augmented by an illustration of the time-dependent states of the particles. The user of our tool — called dPSO-Vis — is able to analyze the swarm's behavior within the search space. We illustrate our approach with a brief analysis of a PSO algorithm that predicts the secondary structure of RNA molecules. | |
 |
[40]
OpenWalnut: An Open-Source Tool for Visualization of Medical and Bio-Signal Data
In Olaf Dössel (editor): Biomedizinische Technik/Biomedical Engineering 9 2013 [DOI: 10.1515/bmt-2013-4183] [paper] |
| Abstract: The number of medical imaging modalities and bio-signal acquisition methods has increased dramatically in the last years. Each is designed to answer a certain set of questions or to explore certain features of living tissue. With visualization, it is possible to combine these different types of images and data to grasp their meaning in the context of each other. Unfortunately, many existing visualization tools are focused on certain modalities and signals. With OpenWalnut, we provide a tool which is designed to be used with different signals and modalitites in combination with each other. It aims at providing interactive rendering and explorability whith a clean data-flow-based interface. The project is open-source and well documented and has yet been extended and used by many groups and researchers. In this short paper, we provide a coarse overview of the principles and focus-points of OpenWalnut. | |
| 2012 | |
 |
[39]
Fabric-like Visualization of Tensor Field Data on Arbitrary Surfaces in Image Space.
In Burgeth, B., Laidlaw, D.H. (editors): New Developments in the Visualization and Processing of Tensor Fields , Springer-Verlag, Heidelberg, Germany/Dagstuhl Seminar 09302, 2009 pp. 71-92 2012 [DOI: 10.1007/978-3-642-27343-8] [ISBN: 978-3-642-27342-1] [Preprint] |
| Abstract: Tensors are of great interest to many applications in engineering and in medical imaging, but a proper analysis and visualization remains challenging. It already has been shown that, by employing the metaphor of a fabric structure, tensor data can be visualized precisely on surfaces where the two eigendirections in the plane are illustrated as thread-like structures. This leads to a continuous visualization of most salient features of the tensor data set. We introduce a novel approach to compute such a visualization from tensor field data that is motivated by image-space line integral convolution (LIC). Although our approach can be applied to arbitrary, non-selfintersecting surfaces, the main focus lies on special surfaces following important features, such as surfaces aligned to the neural pathways in the human brain. By adding a postprocessing step, we are able to enhance the visual quality of the of the results, which improves perception of the major patterns. | |
 |
[38]
Vue en tractographie d'un cerveau humain.
LeMonde, Science, Online Newspaper, December 30, 2012 2012 [journal] |
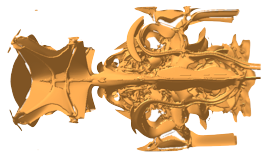
| Abstract: Vue en tractographie d'un cerveau humain. Cette technique d'imagerie r'ev`ele la structure des fibres nerveuses - et leurs traumatismes 'eventuels. | |
 |
[37]
Beyond Topology: A Lagrangian Metaphor to Visualize the Structure of 3D Tensor Fields
In David H. Laidlaw, Anna Vilanova (editors): New Developments in the Visualization and Processing of Tensor Fields , Springer Verlag pp. 93-110 2012 [DOI: 10.1007/978-3-642-27343-8] [ISBN: 978-3-642-27342-1] |
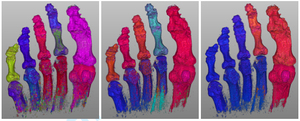
| Abstract: Topology was introduced in the visualization literature some 15 years ago as a mathematical language to describe and capture the salient structures of symmetric second-order tensor fields. Yet, despite significant theoretical and algorithmic advances, this approach has failed to gain wide acceptance in visualization practice over the last decade. In fact, the very idea of a versatile visualization methodology for tensor fields that could transcend application domains has been virtually abandoned in favor of problem-specific feature definitions and visual representations. We propose to revisit the basic idea underlying topology from a different perspective. To do so, we introduce a Lagrangian metaphor that transposes to the structural analysis of eigenvector fields a perspective that is commonly used in the study of fluid flows. Building upon the strong theoretical connections that exist between vector and eigenvector fields, we show that the separatrices of 3D tensor field's topology can in fact be captured in a fuzzy and numerically more robust setting as ridges of a trajectory coherence measure. As a result, we propose an alternative structure characterization strategy for the visual analysis of practical 3D tensor fields, which we demonstrate on several synthetic and computational datasets. | |
 |
[36]
The Topological Effects of Smoothing
IEEE Transactions on Visualization and Computer Graphics, TVCG Vol. 18 No. 1 pp. 160-172 2012 [ISSN: 1077-2626] [DOI: 10.1109/TVCG.2011.74] [Online PDF] [dblp] [PMID: 21519107] |
| Abstract: Scientific data sets generated by numerical simulations or experimental measurements often contain a substantial amount of noise that influences and limits a proper visualization, particularly transfer function design. Smoothing the data removes noise but can have potentially drastic effects on the qualitative nature of the data, thereby influencing its characterization and visualization via topological analysis, for example. We propose a method to track topological changes throughout the smoothing process. As a pre-processing step, we over-smooth the data and collect a list of topological events which are the creation and destruction of extremal points. During rendering, the user can select the number of topological events by interactively manipulating a level-of-detail parameter. The result of a given amount of smoothing is visualized by its effect on the contour tree. Regions corresponding to differences between the contour trees of the original and smoothed datasets are identified automatically. This approach enables visual as well as quantitative analysis of the topological effects of smoothing. | |
 |
[35]
Image-space Tensor Field Visualization Using a LIC-like Method
Visualization in Medicine and Life Sciences, Progress and New Challenges , Springer Verlag , Berlin/Heidelberg, Germany pp. 193-210 2012 [DOI: 10.1007/978-3-642-21608-4_11] [Online PDF] [dblp] [Preprint] [conference] |
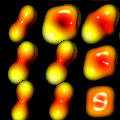
| Abstract: Tensors are of great interest to many applications in engineering and in medical imaging, but a proper analysis and visualization remains challenging. Physics-based visualization of tensor fields has proven to show the main features of symmetric second-order tensor fields, while still displaying the most important information of the data, namely the main directions in medical diffusion tensor data using texture and additional attributes using color-coding, in a continuous representation. Nevertheless, its application and usability remains limited due to its computational expensive and sensitive nature. We introduce a novel approach to compute a fabric-like texture pattern from tensor fields on arbitrary non-selfintersecting surfaces that is motivated by image space line integral convolution (LIC). Our main focus lies on regaining three-dimensionality of the data under user interaction, such as rotation and scaling. We employ a multi-pass rendering approach to estimate proper modification of the LIC noise input texture to support the three-dimensional perception during user interactions. | |
 |
[34]
Towards a High-Quality Visualization of Higher-Order Reynold's Glyphs for Medical Diffusion Tensor Imaging
Visualization in Medicine and Life Sciences, Progress and New Challenges , Springer Verlag , Berlin/Heidelberg, Germany pp. 211-227 2012 [DOI: 10.1007/978-3-642-21608-4_12] [Online PDF] [dblp] [Preprint PDF] [conference] |
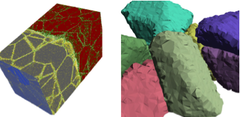
| Abstract: Recent development in magnetic resonance imaging (MRI) has shown, that displaying second-order tensor information reconstructed from diffusion-weighted MRI scans does not display the full structure information acquired by the scanner. Therefore, higher-order methods have been developed. Besides the visualization of derived structures such as stream lines (called fiber tracts or tractography in medical data sets), an extension of Reynold's glyph for second-order tensor field is used to display local information. At the same time, fourth-order data becomes increasingly important in engineering as novel models focus on the change in materials under repeated application of stresses. Due to the complex structure of the glyph, a proper tessellation requires many triangles or quadrilaterals and, therefore, is not suitable for interactive exploration. We introduce a novel way to render this glyph based on interval arithmetic and use standard graphics hardware acceleration to achieve interactive frame rates. | |
 |
[33]
Multi-region Delaunay Complex Segmentation
Computer Aided Geometric Design Special issue on "Foundations of Topological Analysis" Vol. 30 Issue. 6 pp. 588-596 4 2012 [DOI: 10.1016/j.cagd.2012.03.016] [Online PDF] [Preprint PDF] |
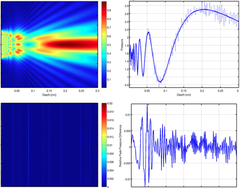
| Abstract: We focus on the problem of segmenting scattered point data into multiple regions in a single segmentation pass. To solve this problem, we begin with a set of potential boundary points and use a Delaunay triangulation to complete the boundaries. We then use information from the triangulation and its dual Voronoi complex to determine for each face whether it resembles a boundary or interior face, allowing a user to choose a specific segmentation by keeping only faces where our parameter is above a threshold. The resulting algorithm has time complexity in O(nd), where n is the number of Delaunay simplices. | |
 |
[32]
GPU accelerated angular spectrum approach for real-time full field acoustic beam predictions
IEEE International Ultrasonics Symposium, P5A - Beam forming II, Conference Poster Presentation/Abstract 10 2012 [Preprint] [conference] |
| Abstract: In our preliminary work, we have demonstrated that ultrasonic drug release using mild hyperthermia is feasible; temperature sensitive drug delivery particles are injected and allowed to accumulate within a region of interest, typically over 6-24 hours. Ultrasound is then scanned through the volume of interest to locally increase the temperature by 2 – 4C for a short period, releasing a drug and increasing its efficacy. In order to translate these methods, ultrasound AND drug dose must each be predicted and validated. We have made great strides on drug dose–we now tackle ultrasound dose for this special problem of mild hyperthermia. Predicting the 3-D heating profile in tissue as a function of time requires knowledge of the acoustic beam intensity as a function of time as it is steered in 3-D space. Ultrasound beams generated from an aperture large enough to deliver the acoustic power necessary for tissue heating must be focused to some degree in order to work at reasonable depths from the aperture face and at depth-of-fields that are not much larger that the desired heating region. Focusing necessitates that the beam be scanned in order to treat larger volumes, such as the volume encompassing a tumor. The beam scanning is accomplished dynamically, in real time, and knowledge of the beam is necessary in order to make predictions on where energy is being deposited and how much is being deposited. This information is important for predicting thermal dose according to Arrhenius-based methods such as Cumulative Equivalent Minutes at 43C (CEM43). | |
 |
[31]
Leading edge vortices of flow over a delta wing.
Gallery of Fluid Motion, poster, P55 11 2012 [Preprint] |
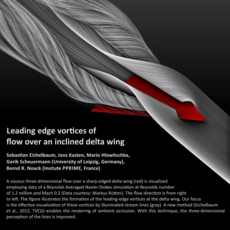
| Abstract: A viscous three-dimensional flow over a sharp-edged delta wing (red) is visualized employing data of a Reynolds Averaged Navier-Stokes simulation at Reynolds number of 1.2 million and Mach 0.2 (Data courtesy: Markus Rütten). The flow direction is from right to left. The figure illustrates the formation of the leading-edge vortices at the delta wing. Our focus is the effective visualization of these vortices by illuminated stream lines (gray). A new method (Eichelbaum et al., 2012, TVCG) enables the rendering of ambient occlusion. With this technique, the three-dimensional perception of the lines is improved. | |
 |
[30]
Comprehensible Presentation of Topological Information
Status report for DOE Exascale Research Conference in Portland, OR. , Berkeley, CA, USA, 94720 No. LBNL-5693E 4 2012 [Online PDF] |
| Abstract: Topological information has proven very valuable in the analysis of scientific data. An important challenge that remains is presenting this highly abstract information in a way that it is comprehensible even if one does not have an in-depth background in topology. Furthermore, it is often desirable to combine the structural insight gained by topological analysis with complementary information, such as geometric information. We present an overview over methods that use metaphors to make topological information more accessible to non-expert users, and we demonstrate their applicability to a range of scientific data sets. With the increasingly complex output of exascale simulations, the importance of having effective means of providing a comprehensible, abstract overview over data will grow. The techniques that we present will serve as an important foundation for this purpose. | |
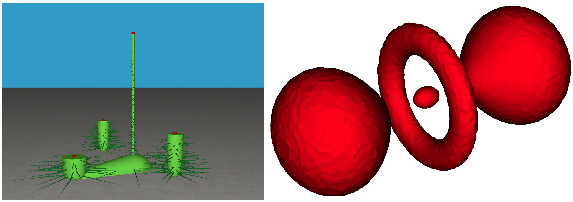 |
[29]
Topology-based Visualization and Analysis of High-dimensional Data and Time-varying Data at the Extreme Scale
DOE Exascale Research Conference , Portland, OR LBNL-5691E-Poster 4 2012 [paper] |
| 2011 | |
 |
[28]
Real-time fused CT/US for Guiding Therapeutic Ultrasound
poster presentation, refereed abstract P476, poster session 4, September 10, 2011 2011 [conference] |
| Abstract: Therapeutic ultrasound (US) has many applications, ranging from tumor ablation, activation of cancer-fighting drugs via mild hyperthermia, and delivery of particles beyond the blood brain barrier. However, the therapeutic US beam must be spatially guided to the region of interest and temperature feedback is necessary for hyperthermia applications. While researchers have successfully used Magnetic Resonance Imaging (MRI) for guidance and temperature feedback, real-time fusion of US with computed tomography (CT) remains widespread. We hypothesize that real-time fused CT/US can aide in guiding US therapy and also enhance US-based thermometry since CT Hounsfiend units can identify tissues in the acoustic beam. Here, we develop and validate a fusion between CT and US that is capable of characterizing bone and fat in real-time. We first characterize registration error and then utilize the CT/US system to identify fatty tissue surrounding tumors in a mouse Met-1 breast cancer model. An electromagnetic (EM) positioning system (NDI, Aurora, Ontario, Canada) was used to localize the ultrasound plane within a CT volume. Briefly, a 6-degree of freedom sensor was attached to an US transducer on a commercial scanner (Siemens Sequoia, Issaquah, WA) and calibrated using a single-point calibration method. The EM-tracked space was registered with the CT space using fiducial registration, while 3D Slicer visualized the real-time fused data. System performance was measured by quantifying calibration error, fiducial registration error, and target registration error. Met-1 tumors in the fat pads of 10 female FVB mice provided a model for tumor growth within fatty tissue. Mice were imaged with CT, and the tumors underwent H&E-stained histology to identify tumor and surrounding fatty tissue. The percentage of fat in the tumor region was quantified by segmenting the images according to Hounsfield units (fatty: -300 to 0 HU, protein-rich: 1 to 300 HU, and bone: HU>300). CT measurements were compared with histology using a signed rank test, and the relationship between fat content and tumor size was examined with linear regression. Our CT/US fusion system can differentiate soft tissue, bone and fat with a spatial accuracy of 1 mm. Fiducial registration error between the CT image space and tracked space was 1.02+/-0.2mm, with a mean target registration error of 1.0+/-0.3 mm on CT and US in fused 2D images. Tumor area measured by CT and histology were correlated (r2=0.92), and the percentage of fat estimated by CT and histology was similar (p > 0.15, signed rank test, Figure 1a). Additionally, CT mapped fat and soft tissue interfaces near the acoustic beam during real-time imaging of Met-1 tumors (Figure 1b-e). We conclude that combined CT/US is a feasible method for guiding interventions by tracking the acoustic focus within a pre-acquired CT volume and characterizing tissues proximal to and surrounding the acoustic focus. | |
 |
[27]
An open environment CT-US fusion for tissue segmentation during interventional guidance
PLoS ONE Vol. 6 Issue. 11:e27372 Epub 2011 [DOI: 10.1371/journal.pone.0027372] [paper] [PMID: 22132098] |
| Abstract: Therapeutic ultrasound (US) can be noninvasively focused to activate drugs, ablate tumors and deliver drugs beyond the blood brain barrier. However, well-controlled guidance of US therapy requires fusion with a navigational modality, such as magnetic resonance imaging (MRI) or X-ray computed tomography (CT). Here, we developed and validated tissue characterization using a fusion between US and CT. The performance of the CT/US fusion was quantified by the calibration error, target registration error and fiducial registration error. Met-1 tumors in the fat pads of 12 female FVB mice provided a model of developing breast cancer with which to evaluate CT-based tissue segmentation. Hounsfield units (HU) within the tumor and surrounding fat pad were quantified, validated with histology and segmented for parametric analysis (fat: -300 to 0 HU, protein-rich: 1 to 300 HU, and bone: HU>300). Our open source CT/US fusion system differentiated soft tissue, bone and fat with a spatial accuracy of 1 mm. Region of interest (ROI) analysis of the tumor and surrounding fat pad using a 1 mm2 ROI resulted in mean HU of 68+/-44 within the tumor and -97+/-52 within the fat pad adjacent to the tumor (p<0.005). The tumor area measured by CT and histology was correlated (r2 = 0.92), while the area designated as fat decreased with increasing tumor size (r2 = 0.51). Analysis of CT and histology images of the tumor and surrounding fat pad revealed an average percentage of fat of 65.3% vs. 75.2%, 36.5% vs. 48.4%, and 31.6% vs. 38.5% for tumors <75 mm3, 75-150 mm3 and >150 mm3, respectively. Further, CT mapped bone-soft tissue interfaces near the acoustic beam during real-time imaging. Combined CT/US is a feasible method for guiding interventions by tracking the acoustic focus within a pre-acquired CT image volume and characterizing tissues proximal to and surrounding the acoustic focus. | |
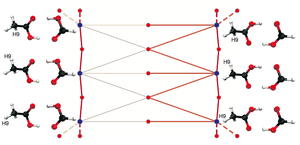 |
[26]
Topology-based Visualization of Transformation Pathways in Complex Chemical Systems
In H. Hauser, H. Pfister, J.J. van Wijk (editor): Computer Graphics Forum, Special Issue , Wiley-Blackwell Vol. 30 No. 3 pp. 663-672 6 2011 [DOI: 10.1111/j.1467-8659.2011.01915.x] [Online PDF] [dblp] |
| Abstract: Transformation in chemical systems is of fundamental interest in chemistry. Typically, transformation is studied by considering energy as a function of coordinates of system components. Analyzing this energy function, defined on a high-dimensional domain, improves our understanding of these systems and may lead to the design of new materials and reactions. Currently, there is a lack of effective visualization techniques for these multi-dimensional functions, and chemists often study only one or two parameters of interest at a time. Developing a comprehensive understanding of these complex systems requires new visualization techniques that show relationships between all coordinates at the same time. We propose a new visualization technique that combines concepts from topological analysis, multi-dimensional scaling, and graph layout to enable the analysis of energy functions for a wide range of molecular structures. We also highlight the usefulness of our technique for studying the energy function of a dimer of formic and acetic acids and a LTA zeolite structure, in which we consider diffusion of methane. | |
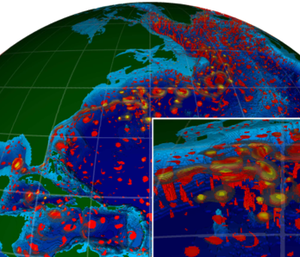 |
[25]
Visualization and Analysis of Eddies in a Global Ocean Simulation
In H. Hauser, H. Pfister, J.J. van Wijk (editor): Computer Graphics Forum, Special Issue , Eurographics/Wiley-Blackwell Vol. 30 No. 3 pp. 991-1000 6 2011 [DOI: 10.1111/j.1467-8659.2011.01948.x] [Online PDF] [dblp] [Preprint PDF] |
| Abstract: We present analysis and visualization of flow data from a high-resolution simulation of the dynamical behavior of the global ocean. Of particular scientific interest are coherent vortical features called mesoscale eddies. We first extract high-vorticity features using a metric from the oceanography community called the Okubo-Weiss parameter. We then use a new circularity criterion to differentiate eddies from other non-eddy features like meanders in strong background currents. From these data, we generate visualizations showing the three-dimensional structure and distribution of ocean eddies. Additionally, the characteristics of each eddy are recorded to form an eddy census that can be used to investigate correlations among variables such as eddy thickness, depth, and location. From these analyses, we gain insight into the role eddies play in large-scale ocean circulation. | |
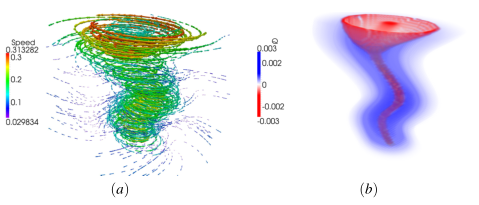 |
[24]
Adaptive Extraction and Quantification of Geophysical Vortices
IEEE Transaction on Visualization and Computer Graphics Vol. 17 Issue. 12 pp. 2088-95 10 2011 [DOI: 10.1109/TVCG.2011.162] [dblp] [PMID: 22034327] |
| Abstract: We consider the problem of extracting discrete axis-aligned vortices from a turbulent flow. In our approach we use a reference model describing the expected physics and geometry of an idealized vortex. The model allows us to derive a novel correlation between the size of the vortex and its strength, measured as the square of its strain minus the square of its vorticity. For vortex detection in real models we use the strength parameter to locate potential vortex cores, then measure the similarity of our ideal analytical vortex and the real vortex core for different strength thresholds. This approach provides a metric for how well a vortex core is modeled by an ideal vortex. Moreover, this provides insight into the problem of choosing the thresholds that identify a vortex. By selecting a target coefficient of determination (i.e., statistical confidence), we determine on a per-vortex basis what threshold of the strength parameter would be required to extract that vortex at the chosen confidence. We validate our approach on real data from a global ocean simulation and derive from it a map of expected vortex strengths over the global ocean. | |
 |
[23]
Visualizing DTI Parameters on Boundary Surfaces of White Matter Fiber Bundles
IASTED International Conference on Computer Graphics and Imaging 2011, Innsbruck, Austria , ACTA Press , Berlin/Heidelberg, Germany pp. 53-61 2 2011 [ISBN: 978-0-88986-865-6] [conference] [youtube] |
| Abstract: Diffusion magnetic resonance imaging is so far the only medical imaging modality that has the potential for probing anatomical brain connectivity \emphin vivo. Specifically, it provides the data basis for a set of techniques allowing for tracking of fiber bundles in the brain's white matter. Furthermore, due to the micro-structural basis of the diffusion process, fiber integrity might be estimated. Typically, this is achieved by tensor-derived parameters, such as by fractional anisotropy (FA), which allows for a quantification of the directionality of local diffusion properties. In neuroscience, such parameterization of the diffusion tensor has greatly stimulated studies of localized brain changes, related to development, aging, or various neurological and psychiatric diseases. However, thus far, there is no satisfactory solution for the visualization and assessment of such parameters along fiber bundles. In this paper, we present a novel technique to visualize changes of tensor-derived parameters along clusters of the trajectories obtained from diffusion tractography. This visualization approach consists of two steps: First, an automatic local aggregation of data values around the trajectories for quantitative analysis and visualization on the fiber bundle boundary and second, a color-coded slice that is intuitively movable along the bundle for interactive exploration of the bundle's parameters. | |
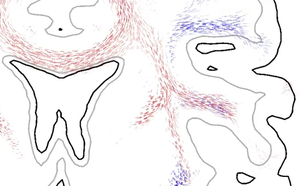 |
[22]
Fiber Stippling: An Illustrative Rendering for Probabilistic Diffusion Tractography
Proceedings BioVis 2011 — 1st IEEE Symposium on Biological Data Visualization , IEEE pp. 23-30 10 2011 [ISBN: 978-1-4673-0003-2] [DOI: 10.1109/BioVis.2011.6094044] [Preprint PDF] [youtube] |
| Abstract: One of the most promising avenues for compiling anatomical brain connectivity data arises from diffusion magnetic resonance imaging (dMRI). dMRI provides a rather novel family of medical imaging techniques with broad application in clinical as well as basic neu-roscience as it offers an estimate of the brain's fiber structure completely non-invasively and in vivo. A convenient way to reconstruct neuronal fiber pathways and to characterize anatomical connectivity from this data is the computation of diffusion tractograms. In this paper, we present a novel and effective method for visualizing probabilistic tractograms within their anatomical context. Our illustrative rendering technique, called fiber stippling, is inspired by visualization standards as found in anatomical textbooks. These illustrations typically show slice-based projections of fiber pathways and are typically hand-drawn. Applying the automatized technique to diffusion tractography, we demonstrate its expressiveness and intuitive usability as well as a more objective way to present white-matter structure in the human brain. | |
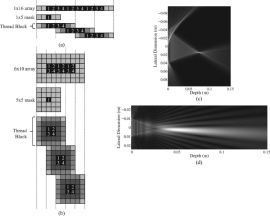 |
[21]
Fast Ultrasound Beam Prediction for Linear and Regular Two-dimensional Arrays
IEEE Transactions on Ultrasonics, Ferroelectrics, and Frequency Control Vol. 58 No. 9 pp. 2001-2012 8 2011 [DOI: 10.1109/TUFFC.2011.2044] [ISSN: 0885-3010] [Online PDF] [journal] [PMID: 21937338] |
| Abstract: Real-time beam predictions are highly desirable for the patient-specific computations required in ultrasound therapy guidance and treatment planning. To address the longstanding issue of the computational burden associated with calculating the acoustic field in large volumes, we use graphics processing unit (GPU) computing to accelerate the computation of monochromatic pressure fields for therapeutic ultrasound arrays. In our strategy, we start with acceleration of field computations for single rectangular pistons, and then we explore fast calculations for arrays of rectangular pistons. For single-piston calculations, we employ the fast near-field method (FNM) to accurately and efficiently estimate the complex near-field wave patterns for rectangular pistons in homogeneous media. The FNM is compared with the Rayleigh-Sommerfeld method (RSM) for the number of abscissas required in the respective numerical integrations to achieve 1%, 0.1%, and 0.01% accuracy in the field calculations. Next, algorithms are described for accelerated computation of beam patterns for two different ultrasound transducer arrays: regular 1-D linear arrays and regular 2-D linear arrays. For the array types considered, the algorithm is split into two parts: 1) the computation of the field from one piston, and 2) the computation of a piston-array beam pattern based on a pre-computed field from one piston. It is shown that the process of calculating an array beam pattern is equivalent to the convolution of the single-piston field with the complex weights associated with an array of pistons. Our results show that the algorithms for computing monochromatic fields from linear and regularly spaced arrays can benefit greatly from GPU computing hardware, exceeding the performance of an expensive CPU by more than 100 times using an inexpensive GPU board. For a single rectangular piston, the FNM method facilitates volumetric computations with 0.01% accuracy at rates better than 30 ns per field point. Furthermore, we demonstrate array calculation speeds of up to 11.5 X 10(9) field-points per piston per second (0.087 ns per field point per piston) for a 512-piston linear array. Beam volumes containing 256(3) field points are calculated within 1 s for 1-D and 2-D arrays containing 512 and 20(2) pistons, respectively, thus facilitating future real-time thermal dose predictions. | |
| 2010 | |
 |
[20]
Electromagnetically Tracked Ultrasound for Small Animal Imaging
Proceedings of the 2010 IEEE International Ultrasonics Symposium (IUS), San Diego, CA , IEEE, UFFC pp. 813-816 2010 [DOI: 10.1109/ULTSYM.2010.5935800] |
| Abstract: The fusion of computed tomography (CT) and ultrasound (US) imaging has recently been examined for guiding interventional procedures such as biopsy, local drug delivery and radiofrequency ablation. During combined CT/US procedures, US facilitates real time visualization of blood flow and tissue structure, while CT provides a three-dimensional view of an extended region and is capable of differentiating tissue types based on Hounsfield units (HU). Our laboratory is working to extend this fusion to include therapeutic US co-registered with CT. Here, we demonstrate the ability to differentiate fat, protein-rich regions, and bone with CT by comparing segmented CT images to histology. Then we present methods for semi-automated registration between tracked US and CT with the objective of imaging and guiding acoustic therapy in small animals. A calibration phantom and fiducial markers were used to generate accurate transformation between the real-time US and pre-acquired CT image stack. The mean error in transducer calibration was 0.7+/-0.5mm with a maximum error of 1.75mm. Target registration error (TRE) of 1.98+/-1.12mm was observed between US and CT images of a dual-modality phantom. The combined CT/US system provides CT-based guidance with enough accuracy to plan and guide US-induced hyperthermia. | |
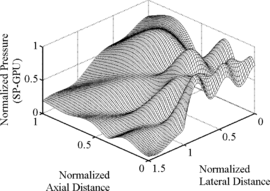 |
[19]
Fast Ultrasound Beam Prediction for Linear and Regular Two-dimensional Arrays
Proceedings of the IEEE Ultrasonics Symposium (IUS) 2010 pp. 2199-2202 2010 [DOI: 10.1109/ULTSYM.2010.5935916] |
| Abstract: Real-time beam predictions are desirable for ultra sound therapy guidance, as treatment planning requires individualized computations. To address the long-standing issue of the computational burden associated with calculating the acoustic field in large volumes, we use modern graphics processing units to accelerate the calculation of near-field pressure fields for therapeutic ultrasound arrays. First, we accelerate field computations for single rectangular pistons by employing the Fast Near-field Method (FNM) to accurately and efficiently estimate the complex near-field wave patterns in homogeneous media, and results are compared to the Rayleigh-Sommerfeld method. We then compute beam patterns of ID and 2D piston arrays using pre-calculated beam patterns from a single piston. Our results show that these algorithms can benefit greatly from GPU computing hardware, exceeding a modern CPU by a factor of over 100. For a single rectangular piston, the FNM is able to calculate a 0.01% accurate field within 30 ns per field point. Furthermore, we demonstrate calculation speeds for arrays of up to 11.5E+9 field points per second. Beam volumes containing 2563 field points are calculated within one second for arrays containing up to 512 pistons, thus, facilitating future real-time thermal dose predictions. | |
 |
[18]
Direct Visualization of Fiber Information by Coherence
In Bartz, D., Bohn, S., Hoffmann, J. (editors): International Journal of Computer Assisted Radiology and Surgery, CARS, CUARC.08 Special Issue Vol. 5 Issue. 2 pp. 125-131 2010 [DOI: 10.1007/s11548-009-0302-5] [Online PDF] [dblp] [Preprint PDF] [Preprint] [PMID: 20033521] |
| Abstract: The structure of fiber tracts in DT-MRI data presents a challenging problem for visualization and analysis. We derive visualization of such traces from a local coherence measure and achieve much improved visual segmentation. We introduce a coherence measure defined for fiber tracts. This quantitative assessment is based on infinitesimal deviations of neighboring tracts and allows identification and segmentation of coherent fiber regions. We use a hardware-accelerated implementation to achieve interactive visualization on slices and provide several approaches to visualize coherence information. Furthermore, we enhance existing techniques by combining them with coherence. We demonstrate our method on both a canine heart, where the myocardial structure is visualized, and a human brain, where we achieve detailed visualization of major and minor fiber bundles in a quality similar to and exceeding fiber clustering approaches. Our approach allows detailed and fast visualization of important anatomical structures in DT-MRI data sets. | |
 |
[17]
Tracking Lines in Higher-Order Tensor Fields
In Hans Hagen (editor): Scientific Visualization: Advanced Concepts , Schloss Dagstuhl–Leibniz-Zentrum für Informatik , Dagstuhl, Germany Vol. 1 pp. 124-135 2010 [ISBN13: 978-3-939897-19-4][ISSN: 1868-8977] [DOI: 10.4230/DFU.SciViz.2010.124] [Online PDF] [dblp] [Preprint] |
| Abstract: While tensors occur in many areas of science and engineering, little has been done to visualize tensors with order higher than two. Tensors of higher orders can be used for example to describe complex diffusion patterns in magnetic resonance imaging (MRI). Recently, we presented a method for tracking lines in higher order tensor fields that is a generalization of methods known from first order tensor fields (vector fields) and symmetric second order tensor fields. Here, this method is applied to magnetic resonance imaging where tensor fields are used to describe diffusion patterns for example of hydrogen in the human brain. These patterns align to the internal structure and can be used to analyze interconnections between different areas of the brain, the so called tractography problem. The advantage of using higher order tensor lines is the ability to detect crossings locally, which is not possible in second order tensor fields. In this paper, the theoretical details will be extended and tangible results will be given on MRI data sets. | |
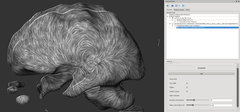 |
[16]
OpenWalnut – An Open-Source Visualization System
In Werner Benger, Andreas Gerndt, Simon Su, Wolfram Schoor, Michael Koppitz, Wolfgang Kapferer, Hans-Peter Bischof, Massimo Di Pierro (editors): EG VCBM 2010 Posters , Berlin, Lehmanns Media-LOB.de pp. 67-78 12 2010 [ISBN: 978-3-86541-361-1] [Online PDF] [Preprint] [conference] |
| Abstract: In the last years, a variety of open-source software packages focusing on visualization of human brain data have evolved. Many of them are designed to be used in a pure academic environment and are optimized for certain tasks or special data. The open source visualization system we introduce here is called OpenWalnut. It is designed and developed to be used by neuroscientists during their research, which enforces the framework to be designed to be very fast and responsive on the one side, but easily extendable on the other side. OpenWalnut is a very application-driven tool and the software is tuned to ease its use. Whereas we introduce OpenWalnut from a user's point of view, we will focus on its architecture and strengths for visualization researchers in an academic environment. | |
 |
[15]
Visualization of Effective Connectivity in the Brain
Proceedings of the 15th International Workshop on Vision, Modeling and Visualization (VMV) Workshop 2010 (Siegen, Germany) in Cooperation with Eurographics Association, Air-la-Ville, Switzerland pp. 155-162 11 2010 [DOI: 10.2312/PE/VMV/VMV10/155-162] [dblp] [Preprint] [conference] [youtube] |
| Abstract: Diffusion tensor images and higher-order diffusion images are the foundation for neuroscience researchers who are trying to gain insight into the connectome, the wiring scheme of the brain. Although modern imaging devices allow even more detailed anatomical measurements, these pure anatomical connections are not sufficient for understanding how the brain processes external stimuli. Anatomical connections constraint the causal influences between several areas of the brain, as they mediate causal influence between them. Therefore, neuroscientists developed models to represent the causal coherence between several pre-defined areas of the brain, which has been measured using fMRI, MEG, or EEG. The dynamic causal modeling (DCM) technique is one of these models and has been improved to use anatomical connection as informed priors to build the effective connectivity model. In this paper, we present a visualization method allowing neuroscientists to perceive both, the effective connectivity and the underlying anatomical connectivity in an intuitive way at the same time. The metaphor of moving information packages is used to show the relative intensity of information transfer inside the brain using a GPU based animation technique. We provide an interactive way to selectively view one or multiple effective connections while conceiving their anatomical connectivity. Additional anatomical context is supplied to give further orientation cues. | |
 |
[14]
Using R-Trees for Interactive Visualization of Large Multidimensional Datasets
6th International Symposium, ISVC 2010, Las Vegas, NV, USA, November 29-December 1, 2010, Proceedings, Part I or II , Springer-Verlag , Berlin/Heidelberg, Germany Vol. 6453–6455 pp. 554-563 11 2010 [ISBN: 978-3-642-17288-5] [DOI: 10.1007/978-3-642-17274-8_54] [dblp] [Preprint PDF] [conference] |
| Abstract: Large, multidimensional datasets are difficult to visualize and analyze. Visualization interfaces are constrained in resolution and dimension, so cluttering and problems of projecting many dimensions into the available low dimensions are inherent. Methods of real-time interaction facilitate analysis, but often these are not available due to the computational complexity required to use them. By organizing the dataset into a level-of-detail (LOD) hierarchy, our proposed method solves problems of both inefficient interaction and visual cluttering. We do this by introducing an implementation of R-trees for large multidimensional datasets. We introduce several useful methods for interaction, by queries and refinement, to explain the relevance of interaction and show that it can be done efficiently with R-trees. We examine the applicability of hierarchical parallel coordinates to datasets organized within an R-tree, and build upon previous work in hierarchical star coordinates to introduce a novel method for visualizing bounding hyperboxes of internal R-tree nodes. Finally, we examine two datasets using our proposed method and present and discuss results. | |
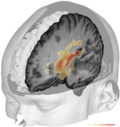 |
[13]
Visualizing white matter fiber tracts with optimally fitted curved dissection surfaces
In Bartz, D., Botha, C.P., Hornegger, J., Machiraju, R., Wiebel, A., Preim, B. (editors): Proceedings of Second Eurographics Workshop on Visual Computing for Biology and Medicine (VCBM 2010) , Eurographics Association , Air-la-Ville, Switzerland pp. 41-48 7 2010 [DOI: 10.2312/VCBM/VCBM10/041-048] [dblp] [conference] |
| Abstract: Klingler dissection [LK56] as well as general blunt [Hei95] dissection of brain white matter shows the fiber bundles in the embedding tissue structures. White matter fiber tractography from diffusion tensor imaging (DTI) is, in general, visualized as 3D lines or tubes together with 2D anatomical MR slices or surfaces. However, determining the exact location of the fiber tracts in their surrounding anatomy is still unsolved. Rendering the embedding anatomy of fiber tracts provides new insight into the exact spatial arrangement of fiber bundles, their spatial relation, and tissue properties surrounding the tracts [SSA*08]. We propose a virtual Klingler dissection method of brain white matter creating curved dissection surfaces locally parallel to user specified fiber bundles. To achieve this effect in computer visualization, we create free-form clipping surfaces that align with the fiber structure of the brain and texture these according to structures they intersect or align with. An optimal view on the naturally embedding curved anatomical structure of the surrounding tissue enables the study of location and course of fiber bundles and the specific relation between different fiber systems in the brain. Indication of the local fiber orientation on the dissected brain surface leads to a representation of both, structural and directional information. The system is demonstrated on a human DTI dataset illustrating the dissection of the sub-insular white matter. | |
| 2009 | |
 |
[12]
Function approximations to accelerate 3-D beam predictions for thermal dose calculations
Proceedings of the IEEE International Ultrasonics Symposium, 2009 pp. 1777-1779 2009 [ISSN: 1948-5719][ISBN: 978-1-4244-4389-5] [DOI: 10.1109/ULTSYM.2009.5441504] |
| Abstract: Robust and safe control of tissue heating requires predictions of beam location, temperature and thermal dose in order to optimize the spatial and temporal distribution of acoustic power. Such calculations are computationally intensive, and our objective is to identify methods to speed up such calculations. Monochromatic beam prediction relies heavily on complex exponentials. We have identified a fast 4th order approximation for the evaluation of a complex exponential using a reduced-complexity polynomial that minimizes absolute error to a maximum of 0.001 ..., and we quantified the effects of the approximation on beam intensity and total acoustic power (TAP) for a 128 physical element transducer array. We demonstrate that ultrasound beam predictions are accelerated by 13x using a fast approximation to evaluate complex exponentials compared to standard libraries. The approximation was optimized to minimize error in TAP, the relevant quantity for thermal diffusion-limited heating. The resulting error in TAP was found to be less than 8E-4%, and the error in intensity was found to be less than 3E-2% as compared to full precision calculations. The same methodology may be applied to other beam prediction algorithms to speed their execution at a relatively minor degradation in accuracy. | |
 |
[11]
FAnToM-Lessons learned from design, implementation, administration, and use of a visualization system for over 10 years
Workshop: Refactoring Visualization from Experience (ReVisE) 2009, co-located with IEEE Visualization 2009, Oct. 2009 2009 [Preprint] |
 |
[10]
Interactive Volume Rendering of Diffusion Tensor Data
In David H. Laidlaw, Joachim Weickert (editors): Visualization and Processing of Tensor Fields: Advances and Perspectives. , Springer-Verlag , Berlin/Heidelberg, Germany pp. 161-176 2009 [ISBN13: 978-3-540-88377-7] [DOI: 10.1007/978-3-540-88378-4_8] [Online PDF] [Preprint PDF] [Preprint] |
| Abstract: We present a method to render multivariate data interactively using a combination of volume-rendering approaches. By overlaying information from frunctional MRI, diffusion-weighted MRI, T1, and T2 data, we are able to display acquired data in context. Focus-and-context interaction techniques allow the interactive exploration and reduce self-occlusion of the data. | |
 |
[9]
Multimodal Visualization of DTI and fMRI Data Using Illustrative Methods
In Hans-Peter Meinzer, Thomas Martin Deserno, Heinz Handels, Thomas Tolxdorff (editors): Bildverarbeitung für die Medizin, Informatik Aktuell, Part 1 , Springer-Verlag, Berlin/Heidelberg, Germany pp. 6-10 6 2009 [DOI: 10.1007/978-3-540-93860-6_2] [ISBN: 978-3-540-93859-0][ISSN: 1431-472X] [Online PDF] [dblp] [Preprint] |
| Abstract: Designing multimodal visualizations combining anatomical and functional brain data is a demanding task. [1] applied illustrative rendering techniques to obtain a high-quality representation of the location and characteristic of brain activation areas (derived from MRI and fMRI). Here, we present the integration of DTI data into this system. Reconstructed nerve fibers connecting functional areas with each other and lower brain areas are embedded into the complex rendering pipeline. Further, we enhanced perception of depth and shape by applying silhouettes and dithered halftoning. | |
| 2008 | |
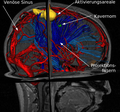 |
[8]
Multimodale Visualisierung von morphologischen und funktionellen Daten für die neurochirurgische Operationsplanung im klinischen Alltag
In Dirk Bartz, Stefan Bohn, Jürgen Hoffmann (editors): curac.08, Tagungsband der 7. Jahrestagung der Deutschen Gesellschaft für Computer- und Roboterassistierte Chirurgie e.V . pp. 81–82 9 2008 [ISBN: 978-3-00-025798-8] |
| Abstract: Diese Arbeit beschreibt einen Ansatz zur multimodalen 3D-Visualisierung von klinischen Patientendaten, um dem Neurochirurgen dreidimensionale Ansichten der Ziel- und Risikostrukturen, sowie ihrer Lage zueinander, zu bieten und ihn damit beim Planungsprozess im klinischen Alltag zu unterstuützen. Dabei legen wir Wert auf Übersichtlichkeit bei einfacher und intuitiver Interaktion und Bedienung (kein aufwendiges Clipping oder Anpassen von Transferfunktionen). Dies sind für Mediziner wichtige Kriterien, die jedoch in bisher publizierten Planungssystemen [1-5] oftmals nicht erfüllt sind. Wir stellen unsere Visualisierung am Fall eines 13-jährigen Mädchens vor, dem ein Kavernom im linken Parietallappen entfernt werden soll. In die Visualisierung sind Kavernom und Risikostrukturen, d.h. Blutgefäß e (MRT), funktionelle Areale des Motorcortex (fMRT), sowie verbindende Nervenbahnen (DTI), integriert. | |
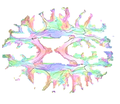 |
[7]
Direkte Darstellung von Faserinformation durch Kohärenzmaße.
In Dirk Bartz, Stefan Bohn, Jürgen Hoffmann (editors): curac.08, Tagungsband der 7. Jahrestagung der Deutschen Gesellschaft für Computer- und Roboterassistierte Chirurgie e.V., Leipzig, Germany pp. 73-75 9 2008 [ISBN: 978-3-00-025798-8] |
| Abstract: Faserverläufe wie sie mittels diffusionsgewichteter Magnetresonanztomographie gemessen werden können liefern eine Fülle an Information, deren direkte Darstellung oft zu einer Überladung des Bildes führt. Mittels lokaler Kohärenzmaße lässt sich diese Darstellung ausdünnen und die Qualität der Bilder dadurch verbessern. Alternativ bietet sie Methoden die dem sonst zeitaufwendigen Clustering von Bahnen entsprechen. Versuche haben gezeigt, dass die Methode robust bezüglich des verwendeten Kohärenzmaßes ist, d.h. eine Änderung des Maßes kaum Änderung im Ergebnis liefert. | |
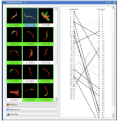 |
[6]
Interactive Comparison of Scalar Fields Based on Largest Contours with Applications to Flow Visualization
IEEE Transaction on Visualization and Computer Graphics Vol. 14 No. 6 pp. 1475-1482 11 2008 [DOI: 10.1109/TVCG.2008.143] [ISSN: 1077-2626] [dblp] [Preprint] [PMID: 18988999] |
| Abstract: Understanding fluid flow data, especially vortices, is still a challenging task. Sophisticated visualization tools help to gain insight. In this paper, we present a novel approach for the interactive comparison of scalar fields using isosurfaces, and its application to fluid flow datasets. Features in two scalar fields are defined by largest contour segmentation after topological simplification. These features are matched using a volumetric similarity measure based on spatial overlap of individual features. The relationships defined by this similarity measure are ranked and presented in a thumbnail gallery of feature pairs and a graph representation showing all relationships between individual contours. Additionally, linked views of the contour trees are provided to ease navigation. The main render view shows the selected features overlapping each other. Thus, by displaying individual features and their relationships in a structured fashion, we enable exploratory visualization of correlations between similar structures in two scalar fields. We demonstrate the utility of our approach by applying it to a number of complex fluid flow datasets, where the emphasis is put on the comparison of vortex related scalar quantities. | |
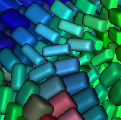 |
[5]
Fast and Memory Efficient GPU-based Rendering of Tensor Data
Proceedings of the IADIS International Conference on Computer Graphics and Visualization 2008 pp. 36-42 7 2008 [ISBN13: 978-972-8924-3-8] [Preprint PDF] [Preprint] [paper] |
| Abstract: Graphics hardware is advancing very fast and offers new possibilities to programmers. The new features can be used in scientific visualization to move calculations from the CPU to the graphics processing unit (GPU). This is useful especially when mixing CPU intense calculations with on the fly visualization of intermediate results. We present a method to display a large amount of superquadric glyphs and demonstrate its use for visualization of measured second–order tensor data in diffusion tensor imaging (DTI) and to stress and strain tensors of computational fluid dynamic and material simulations. | |
| 2007 | |
 |
[4]
Interactive Glyph Placement for Tensor Fields
In George Bebis, Richard Boyle, Bahram Parvin, Darko Koracin, Nikos Paragios, Syeda-Mahmood Tanveer, Tao Ju, Zicheng Liu, Sabine Coquillart, Carolina Cruz-Neira, Torsten Möller, Tom Malzbender (editors): Advances in Visual Computing: Third International Symposium, ISVC, Lake Tahoe, Nevada / California (Lecture Notes in Computer Science) , Springer-Verlag , Berlin/Heidelberg, Germany Vol. LNCS 4841 and LNCS 4842 pp. 331-340 December 2007 [ISBN: 3540768572][ISBN13: 978-3540768579] [DOI: 10.1007/978-3-540-76858-6_33] [dblp] [Preprint PDF] [Preprint] [conference] |
| Abstract: Visualization of glyphs has a long history in medical imaging but gains much more power when the glyphs are properly placed to fill the screen. Glyph packing is often performed via an iterative approach to improve the location of glyphs. We present an alternative implementation of glyph packing based on a Delaunay triangulation to speed up the clustering process and reduce costs for neighborhood searches. Our approach does not require a re–computation of acceleration structures when a plane is moved through a volume, which can be done interactively. We provide two methods for initial placement of glyphs to improve the convergence of our algorithm for glyphs larger and glyphs smaller than the data set's voxel size. The main contribution of this paper is a novel approach to glyph packing that supports simpler parameterization and can be used easily for highly efficient interactive data exploration, in contrast to previous methods. | |
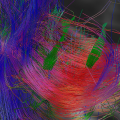 |
[3]
Tensor Lines in Tensor Fields of Arbitrary Order
In George Bebis, Richard Boyle, Bahram Parvin, Darko Koracin, Nikos Paragios, Syeda-Mahmood Tanveer, Tao Ju, Zicheng Liu, Sabine Coquillart, Carolina Cruz-Neira, Torsten Möller, Tom Malzbender (editors): Advances in Visual Computing: Third International Symposium, ISVC, Lake Tahoe, Nevada/California (Lecture Notes in Computer Science) , Springer , Berlin/Heidelberg, Germany Vol. LNCS 4841 and LNCS 4842 pp. 341-350 December 2007 [ISBN: 3540768572][ISBN13: 978-3540768579] [DOI: 10.1007/978-3-540-76858-6_34] [dblp] [Preprint PDF] [Preprint] [conference] |
| Abstract: This paper presents a method to reduce time complexity of the computation of higher–order tensor lines. The method can be applied to higher–order tensors and the spherical harmonics representation, both widely used in medical imaging. It is based on a gradient descend technique and integrates well into fiber tracking algorithms. Furthermore, the method improves the angular resolution in contrast to discrete sampling methods which is especially important to tractography, since there, small errors accumulate fast and make the result unusable. Our implementation does not interpolate derived directions but works directly on the interpolated tensor information. The specific contribution of this paper is a fast algorithm for tracking lines tensor fields of arbitrary order that increases angular resolution compared to previous approaches. | |
| 2005 | |
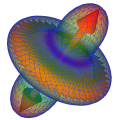 |
[2]
HOT-Lines — Tracking Lines in Higher Order Tensor Fields
In Cláudio T. Silva, Eduard Gröller, Holly Rushmeier (editors): Proceedings of IEEE Visualization 2005 pp. 27–34 October 2005 Ausgezeichnet mit dem 3. Preis des MedVis-Award "Karl-Heinz-Höne-Preis 2006". [ISBN: 0–7803–9462–3] [DOI: 10.1109/VISUAL.2005.1532773] [Online PDF] [dblp] [Preprint] |
| Abstract: Tensors occur in many areas of science and engineering. Especially, they are used to describe charge, mass and energy transport (i.e. electrical conductivity tensor, diffusion tensor, thermal conduction tensor resp.) If the locale transport pattern is complicated, usual second order tensor representation is not sufficient. So far, there are no appropriate visualization methods for this case. We point out similarities of symmetric higher order tensors and spherical harmonics. A spherical harmonic representation is used to improve tensor glyphs. This paper unites the definition of streamlines and tensor lines and generalizes tensor lines to those applications where second order tensors representations fail. The algorithm is tested on the tractography problem in diffusion tensor magnetic resonance imaging (DT-MRI) and improved for this special application. | |
| 2004 | |
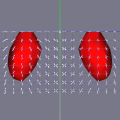 |
[1]
Convolution and Fourier-Transform of Second Order Tensor Fields
In Juan J. Villanieva (editor): Proceedings of Fourth IASTED International Conference Visualization, Imaging, and Image Processing (VIIP '04) pp. 78-83 2004 [ISSN: 1482-7921] [Online PDF] [Preprint] |
| Abstract: The goal of this paper is to transfer convolution, correlation and Fourier transform to second order tensor fields. Convo- lution of two tensor fields is defined using matrix multiplication. Convolution of a tensor field with a scalar mask can thus be described by multiplying the scalars with the real unit matrix. The Fourier transform of tensor fields defined in this paper corresponds to Fourier transform of each of the tensor components in the field. It is shown that for this convolution and Fourier transform, the well known convolution theorem holds and optimization in speed can be achieved by using Fast Fourier Transform (FFT) algorithms. Furthermore, pattern matching on tensor fields based on this convolution is described. | |